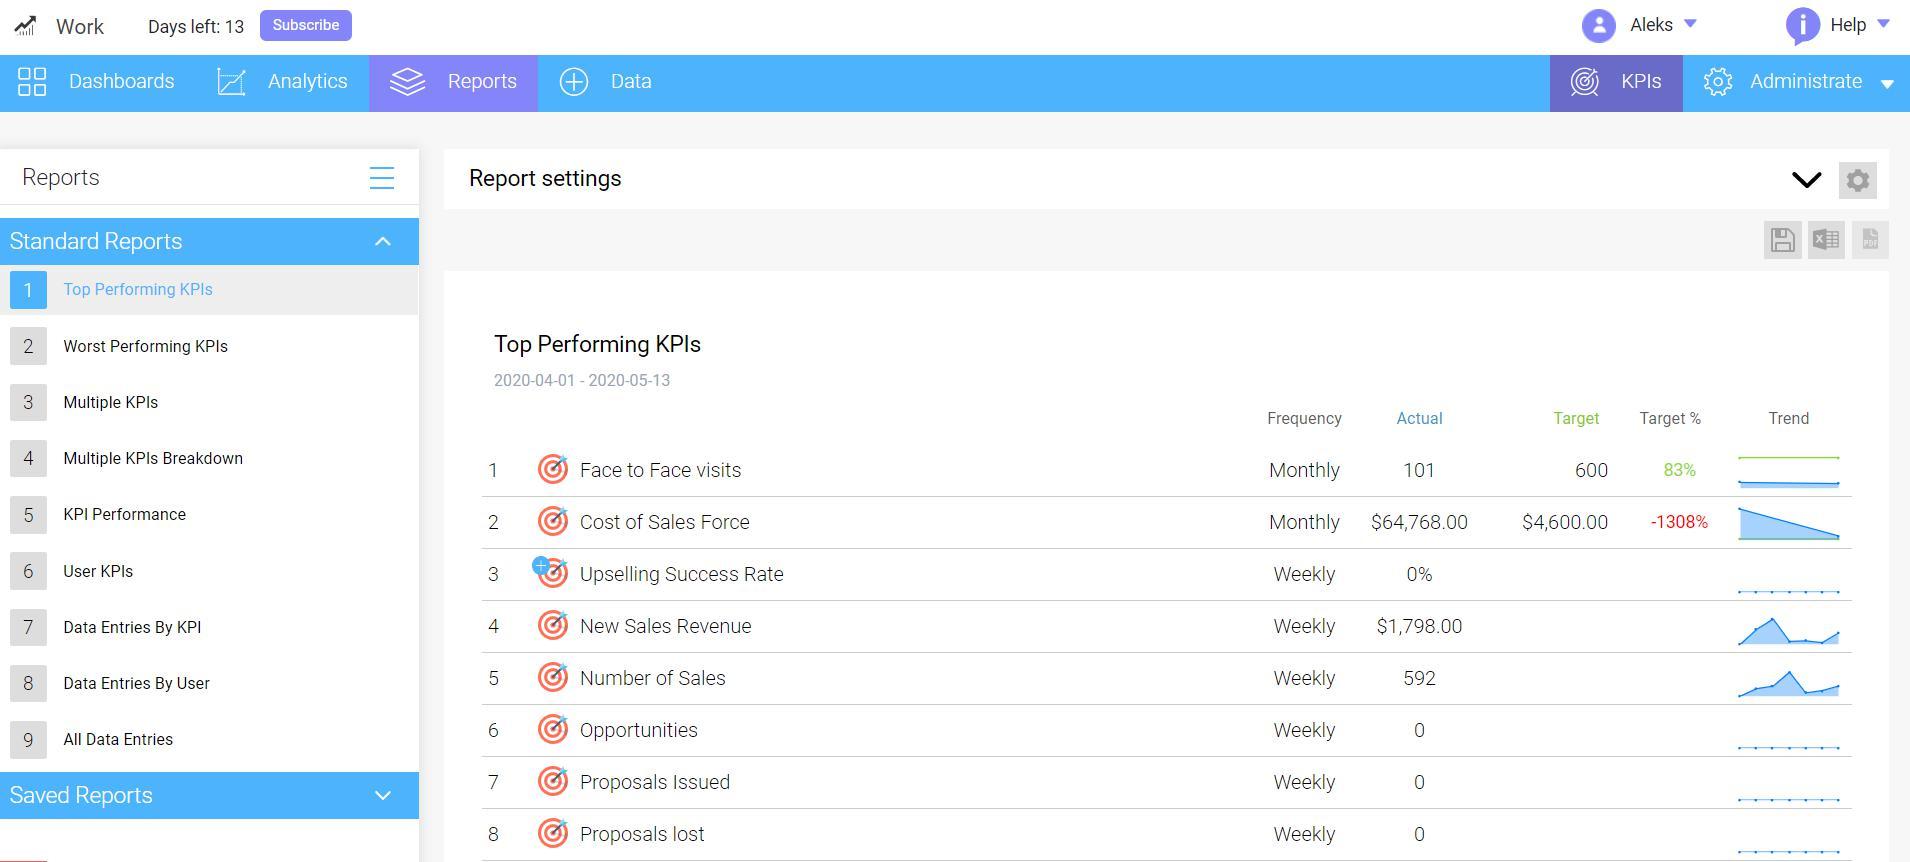
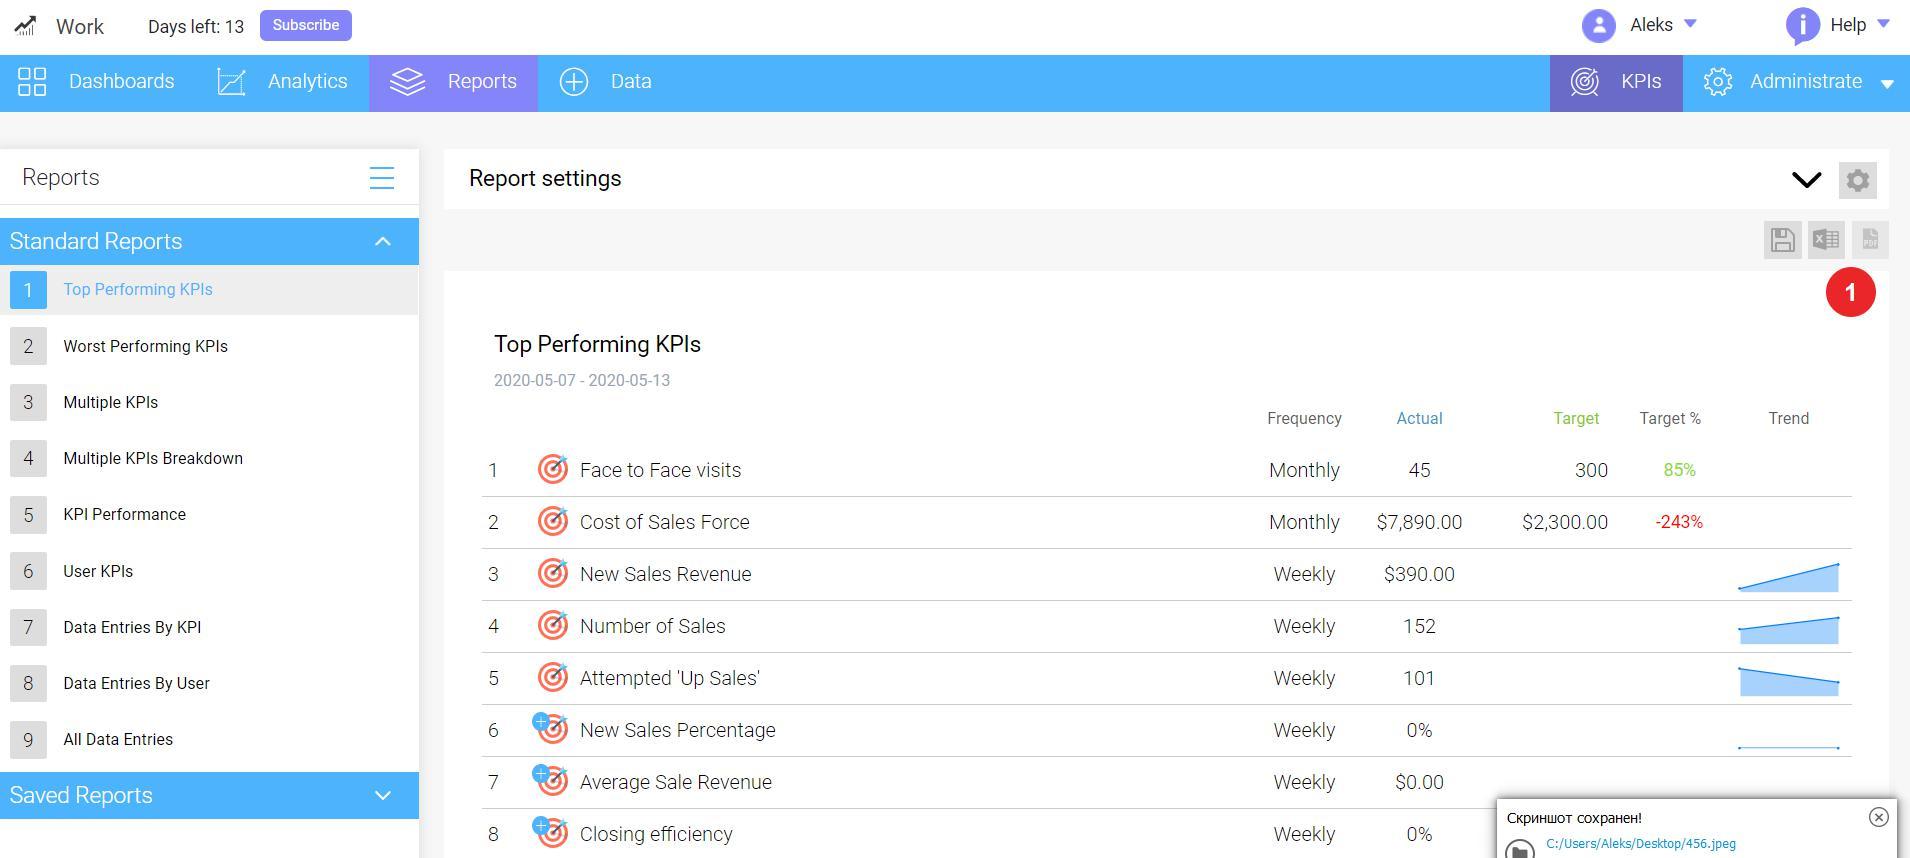
Reports screen is a tool to show the performance of all KPIs in one place. You can manage reports by filtering dates, users, KPIs and other data to set up a report that reflects the data you need.
When you first entering the Reports screen, the default report Top Performing KPI will be selected from a set of best industry practice, custom reports on the left side of the screen menu. You can use the preset reports as drafts to set up custom reports with the data you need.
2. How to select your KPIs
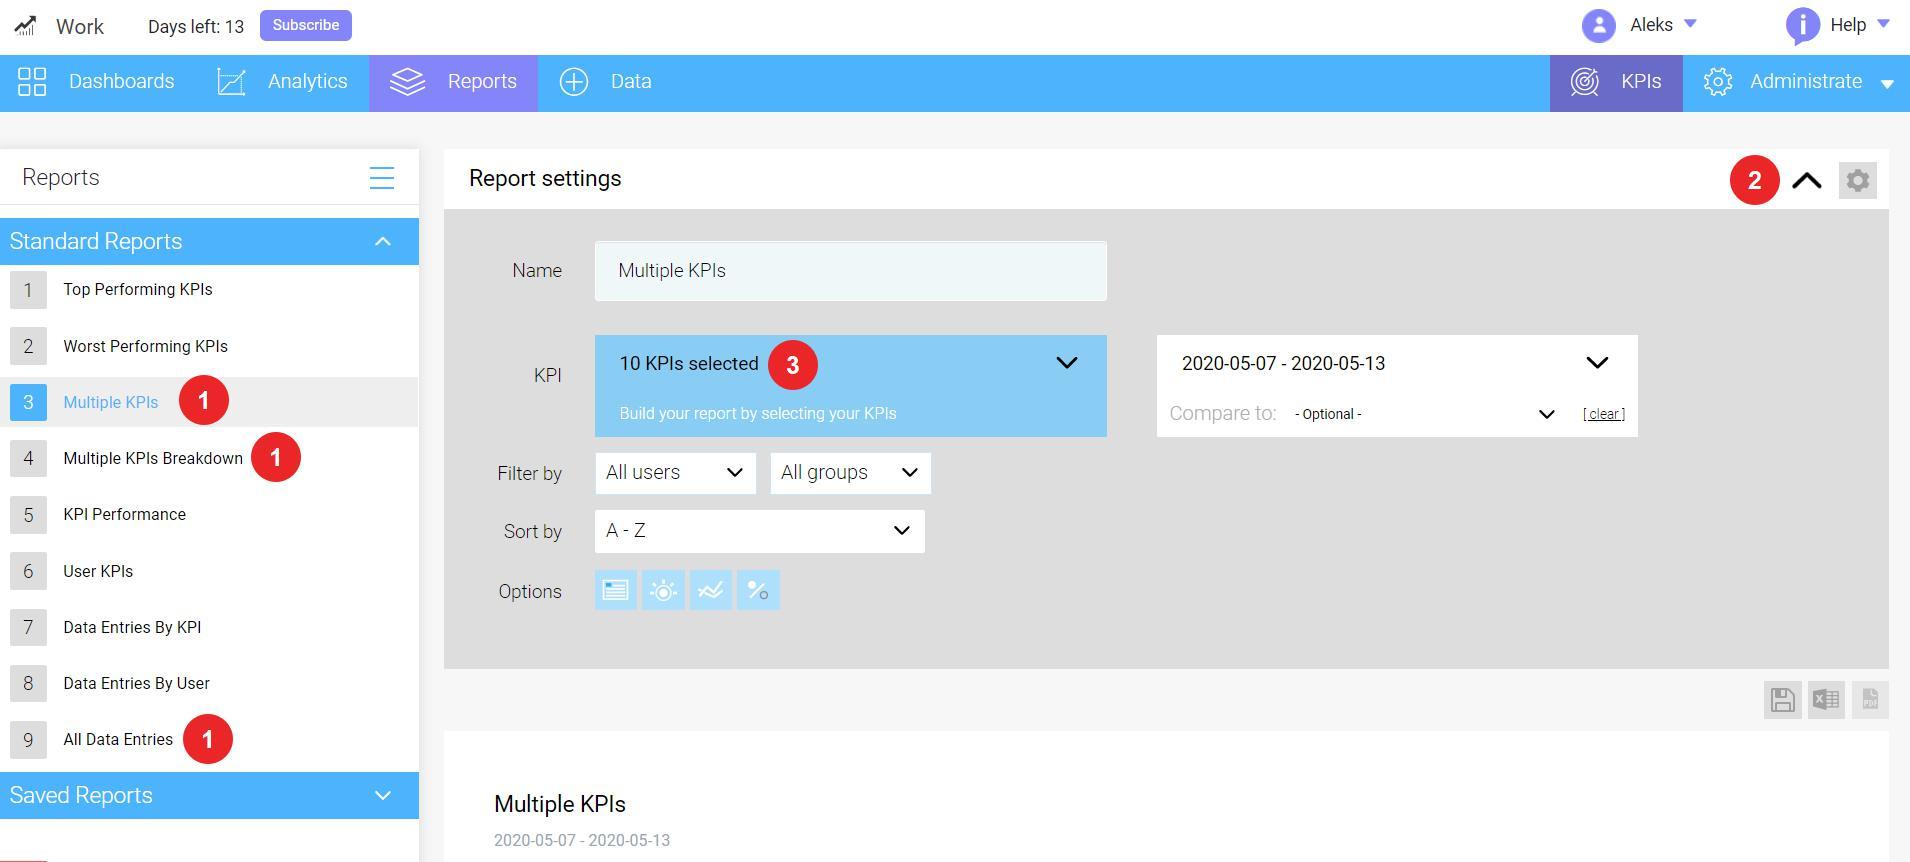
To modify or select a KPI to be included in your report, follow these steps:
Chose any of standard reports corresponding your needs (it could be #3, 4 or 9);
Click drop down Report settings menu;
Click KPI drop down menu;
The sub menu is split into two separate areas: Categories and Selected KPIs;
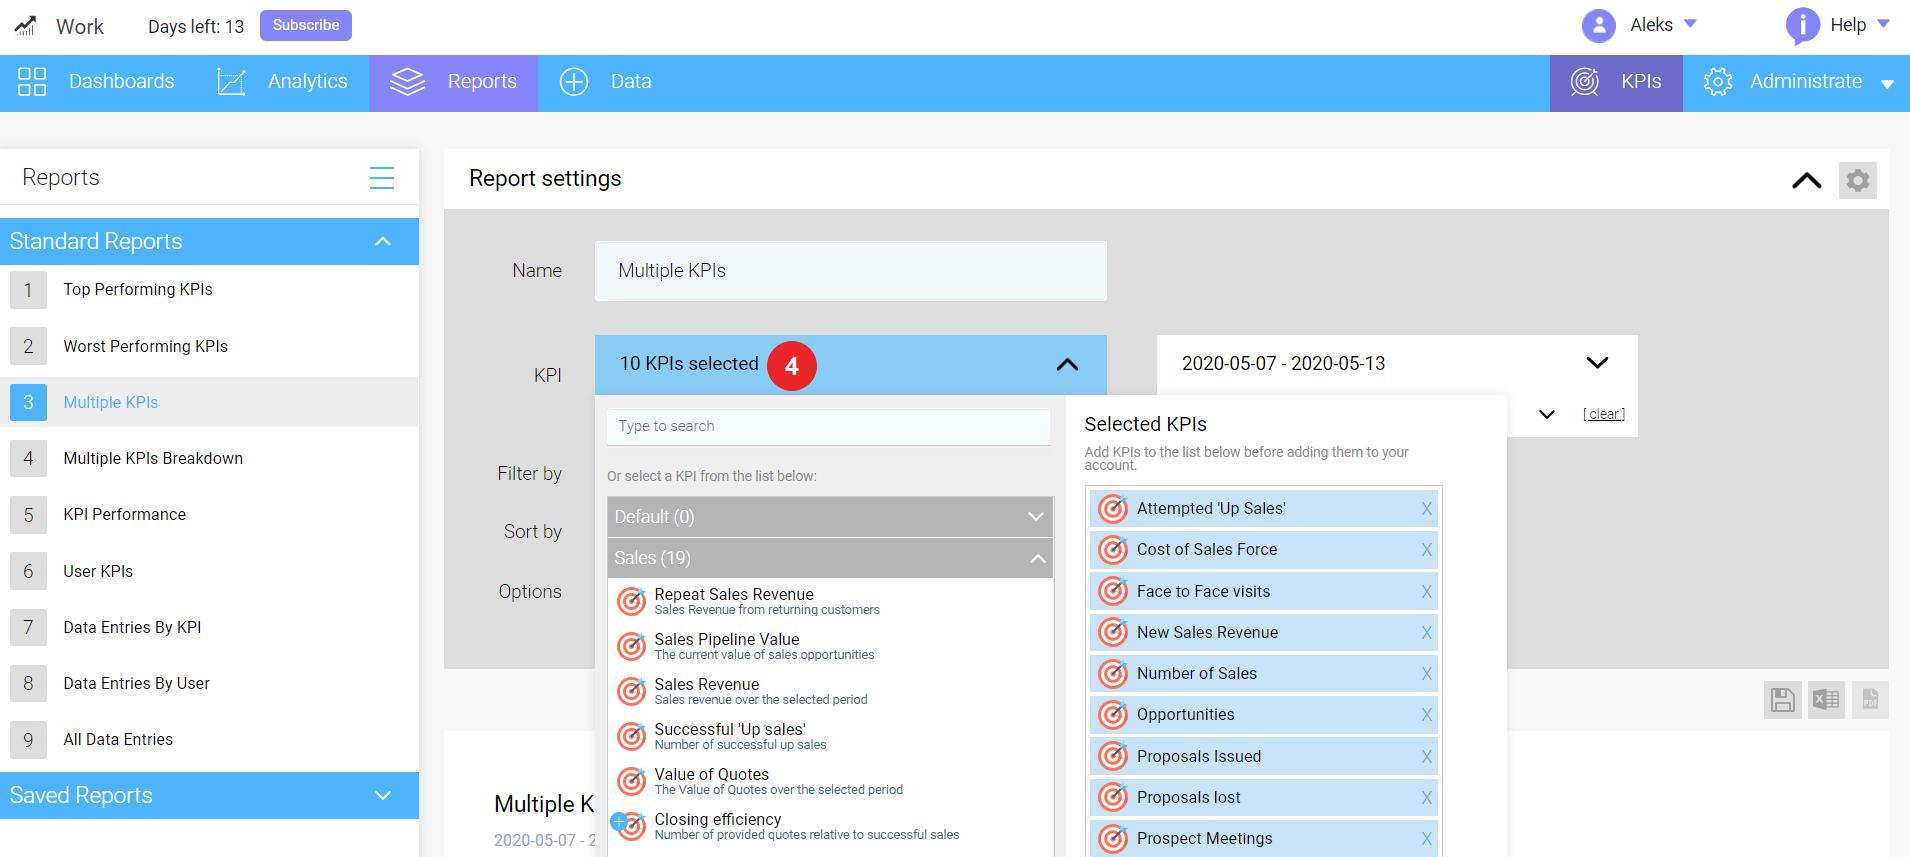
To add a specific KPI, you can use the search function or select the KPI manually from the list of сategories;
When you have found your KPI, click on it;
The selected KPI will appear on the right side in a selected list;
To delete a KPI from the list, click the X icon near the KPI name;
Click Select to finish selecting KPIs for your report.
3. How to use date control
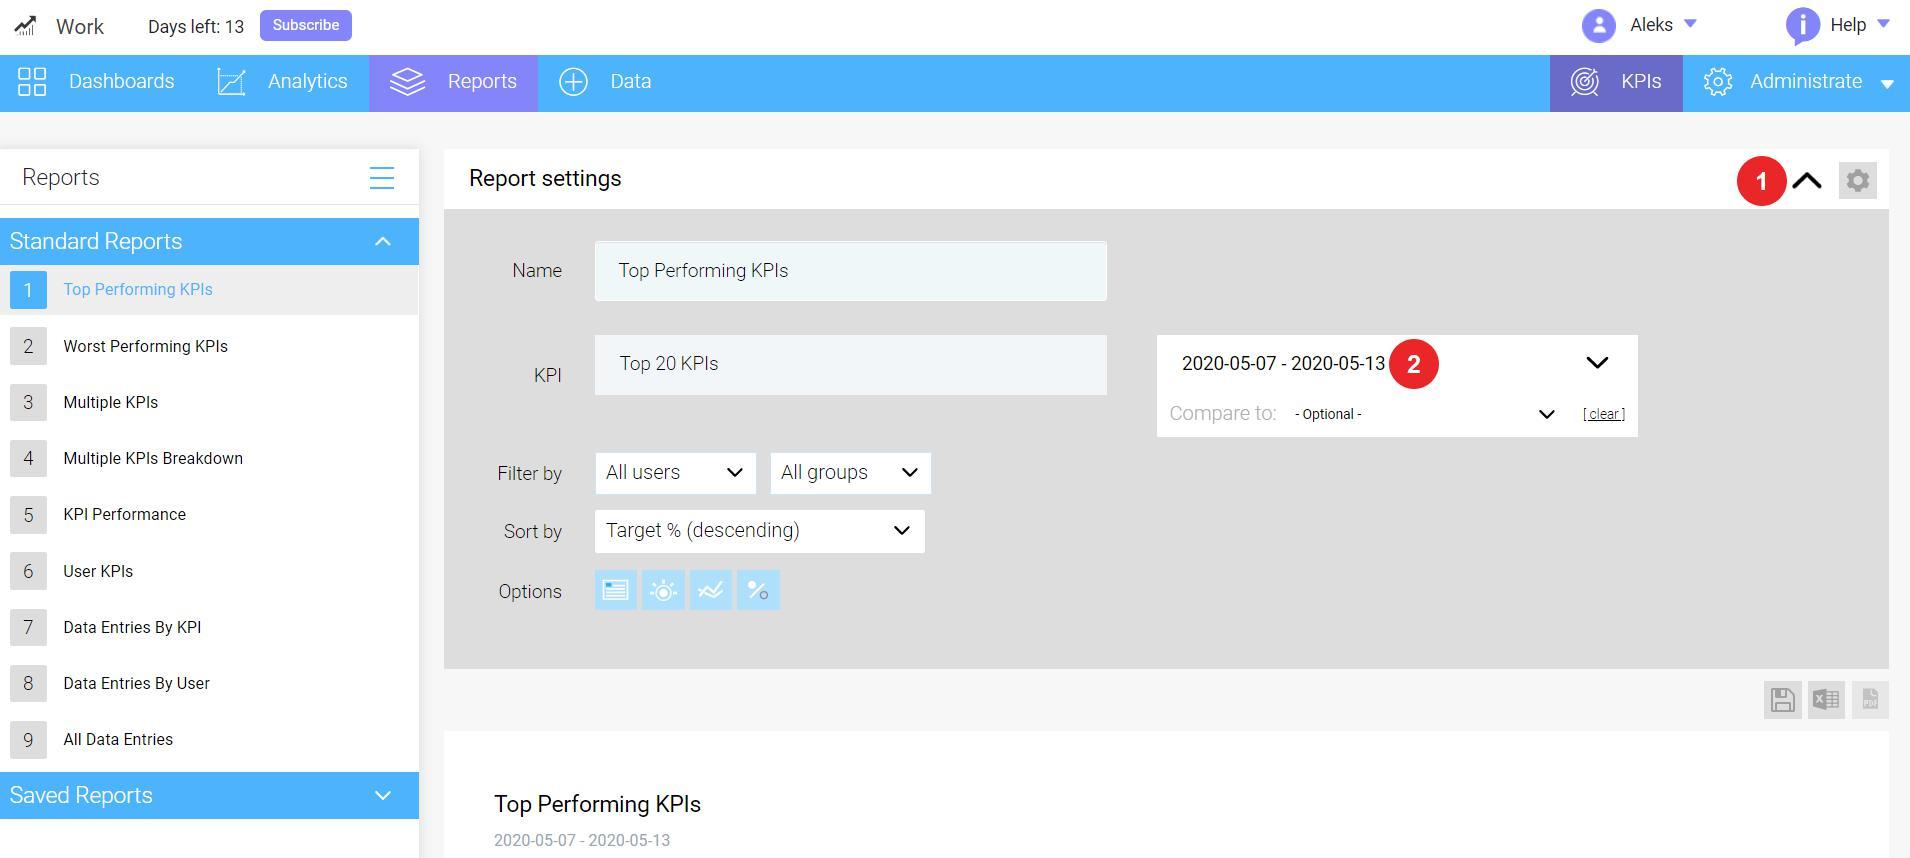
To select a standard date period, follow these steps:
Click drop down Report settings menu;
Click drop down Date control menu;
Select a standard date period (after this, the report will automatically display the data for specified date period);
To select a custom date period, follow these steps:
Click drop down Report settings menu;
Click drop down Date control menu;
Select Start Date and End Date using left and right calendar controls;
Click Apply date range.
The chart will automatically display the data according to the chosen date range.
4. Report Settings
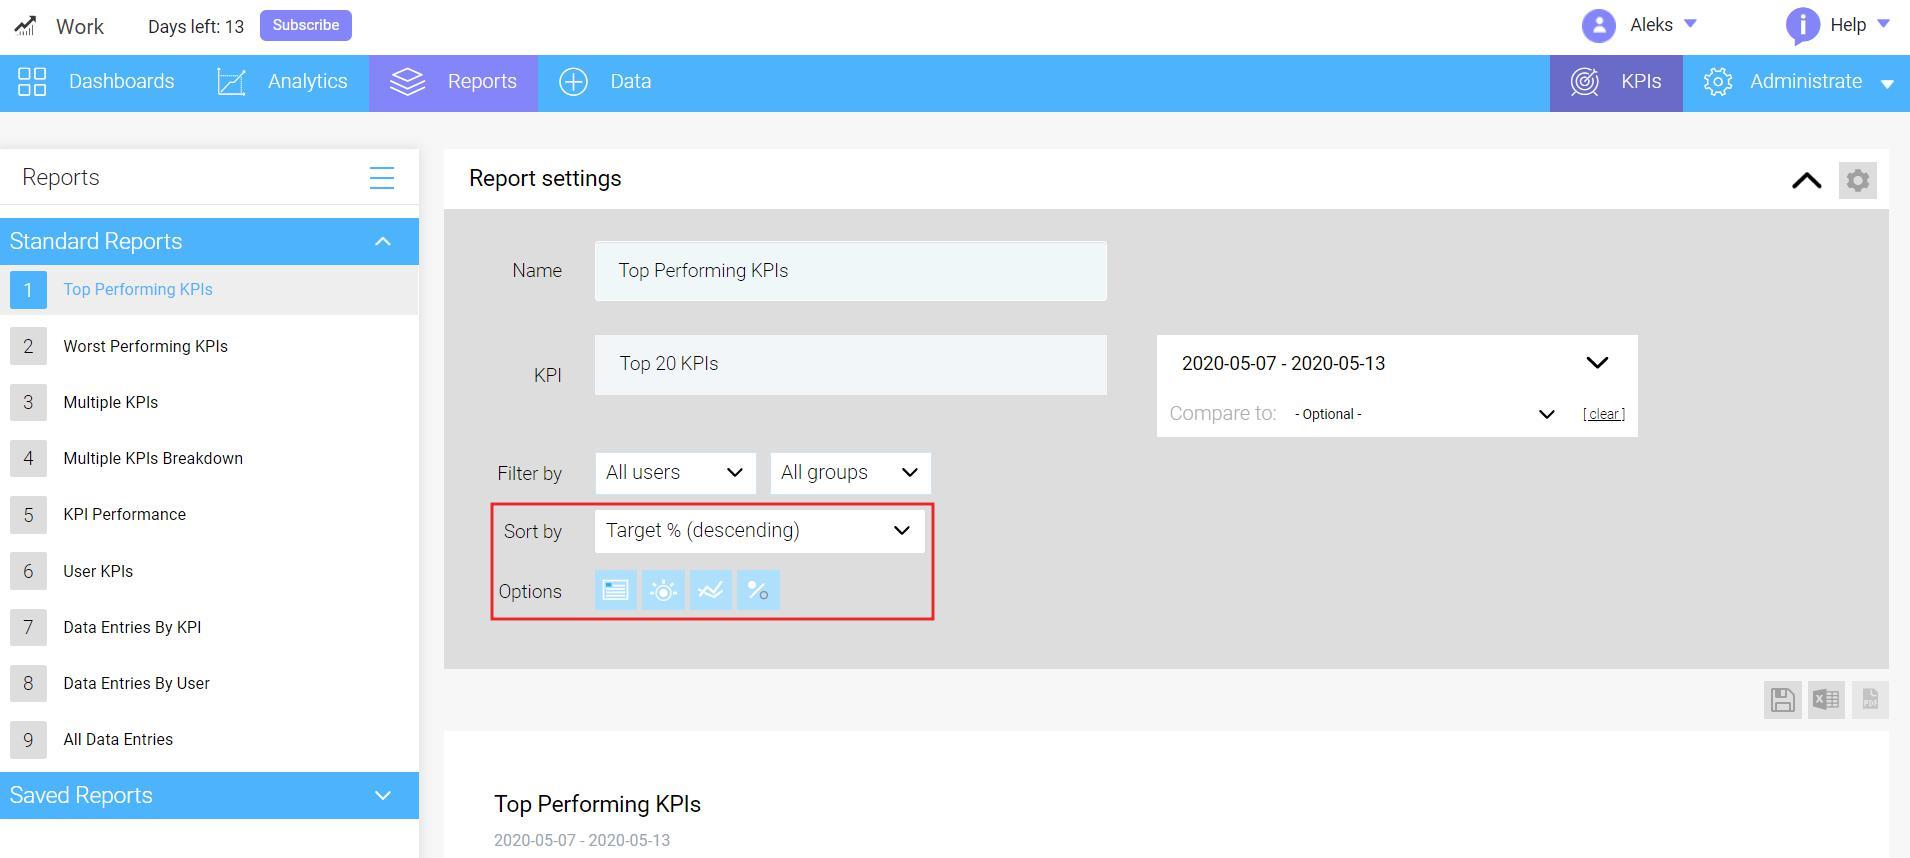
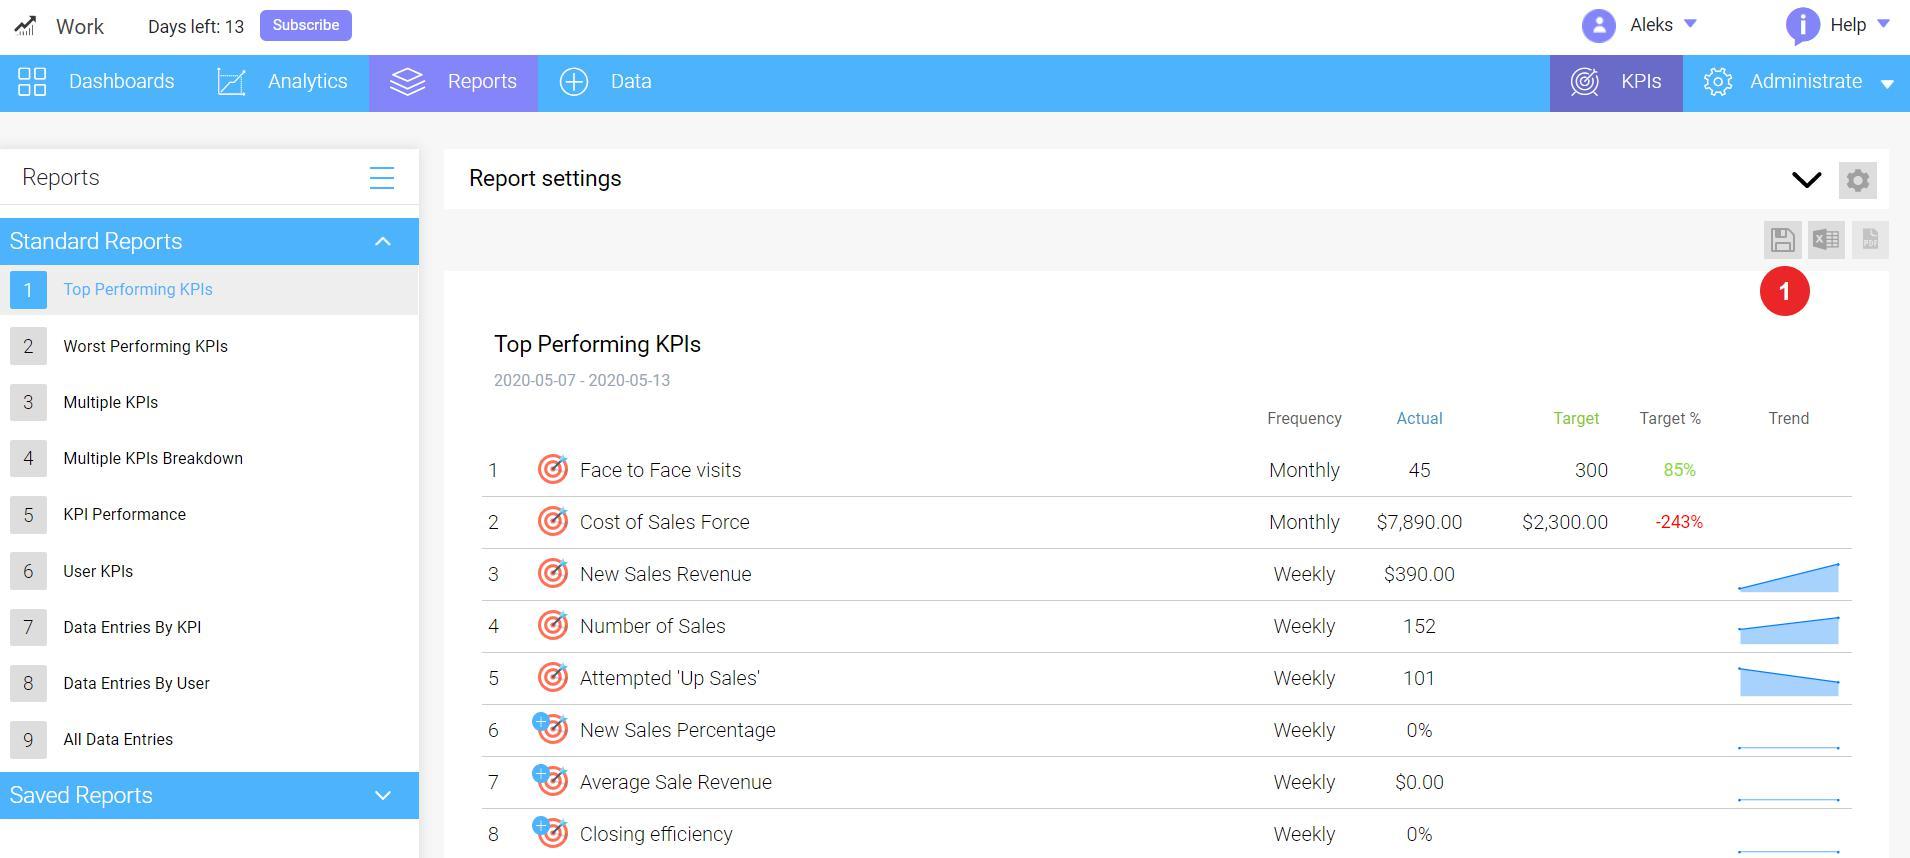
Reports screen has some useful options to customize a report tailored to your needs. You can access the reports option at the top of the report view window. From Sort by and Options sections you would see below for following use:
Show / Hide the frequency;
Show / Hide the trend;
Show / Hide the % from target;
Sort data by:
Actual;
% of Target;
% Change;
A-Z;
Z-A.
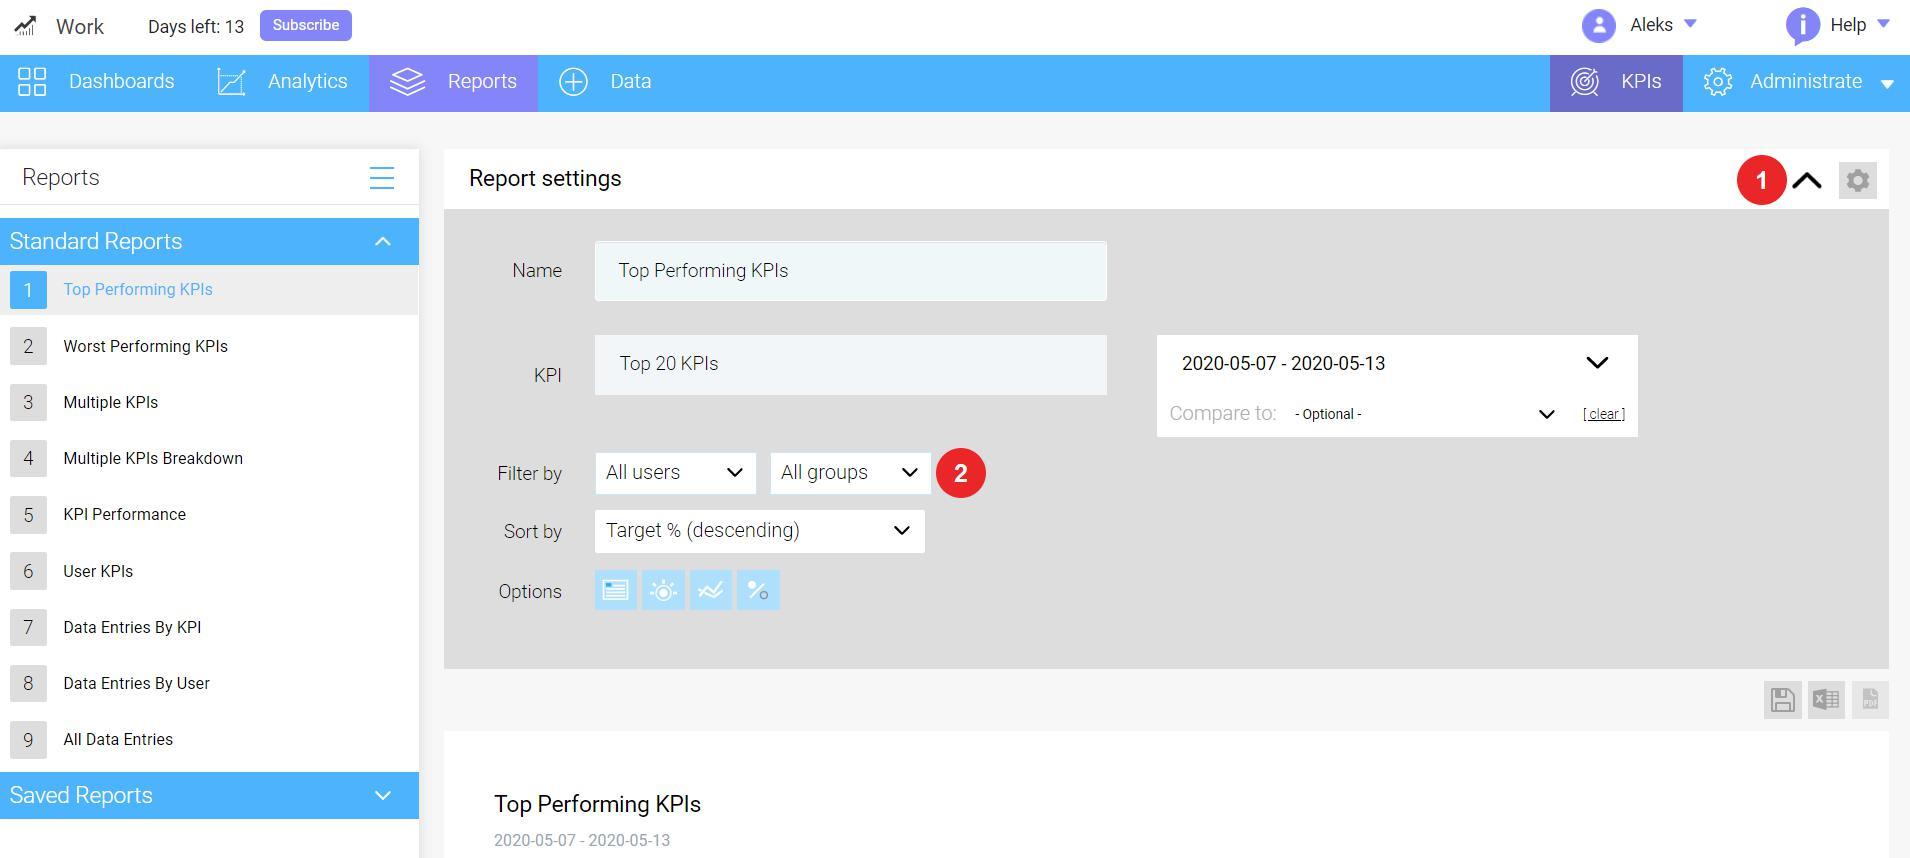
By default, the report will show aggregated data from all KPIs you have selected. If you wish to see data filtered by groups or individual users, follow these steps:
Click drop down Report settings menu;
Click the Users or Groups drop-down menu and select user / group you want to filter from Filter by section;
Click Done.
The view will show only KPI values from the specified users and groups. If you want to clear this filter, remove the selection of values in a drop-down menu and click Done.
5. How to compare KPIs
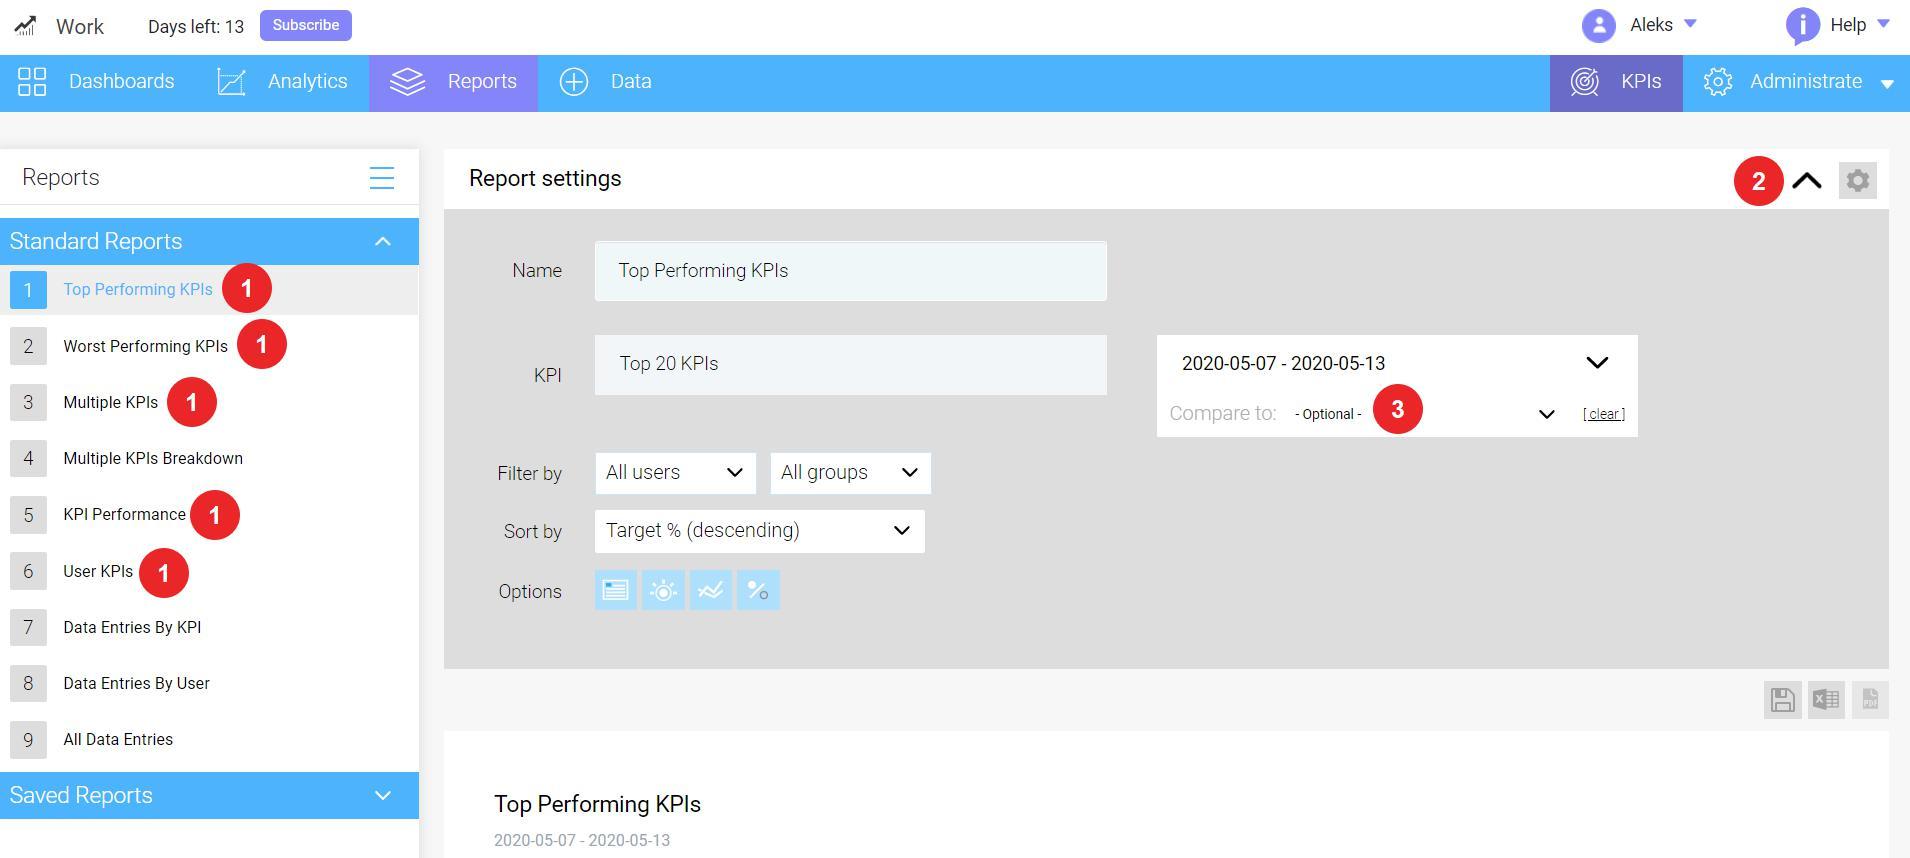
With Waytobi Reports you can compare KPIs against different time periods. In order to do that, follow these steps:
Chose any of standard reports corresponding your needs (it could be #1,2,3,5 or 6);
Click drop down Report settings menu;
In Date field click Compare to open the drop-down menu;
Select a default date range or enter custom time period for comparison;
Click Apply date range.
The KPI report will show you the values on the selected two date ranges and overall percentage change between those periods. To reset the compare date, click the Clear button in the Date control menu.
6. How to save your report
To save your report, please follow these steps:
Click the Save icon from the right-side menu;
Enter a new name for this report;
The report will appear in the left-side menu;
You can delete the report by clicking the Delete icon;
To modify the report, use Report settings section.
7. How to export you report
To export the report, you can click either the PDF or Excel icons from the right-side menu, exporting the report to the corresponding format.
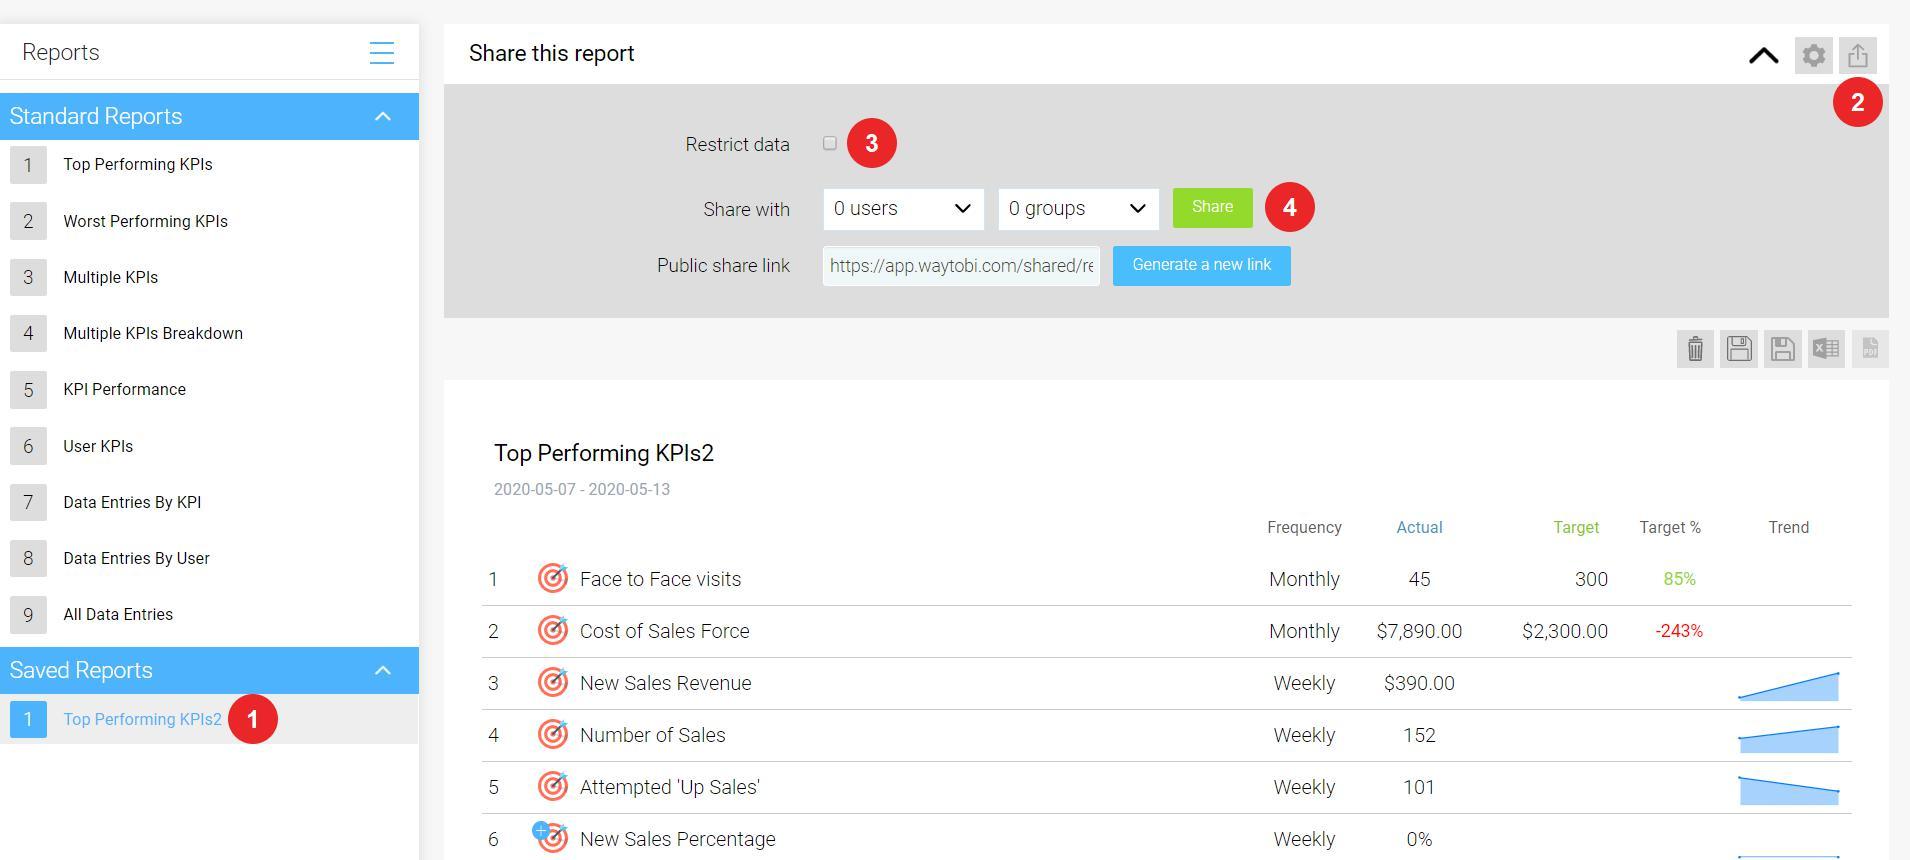
8. How to share your report
You can share the report within different groups of users internally or externally. To share a report internally, please follow these steps:
Chose one of your saved reports you want to share with;
Click the Share icon;
You can manage what data will the users see at the report in the Restrict data section. If you leave checkbox empty (choose "No"), users will see all the data. If you tick the checkbox (choose "Yes"), recipient will have access only to the data they are allowed to see;
From the sharing menu, select the user(s), group or selection of groups with whom you wish to share your report;
Click Share to finish.
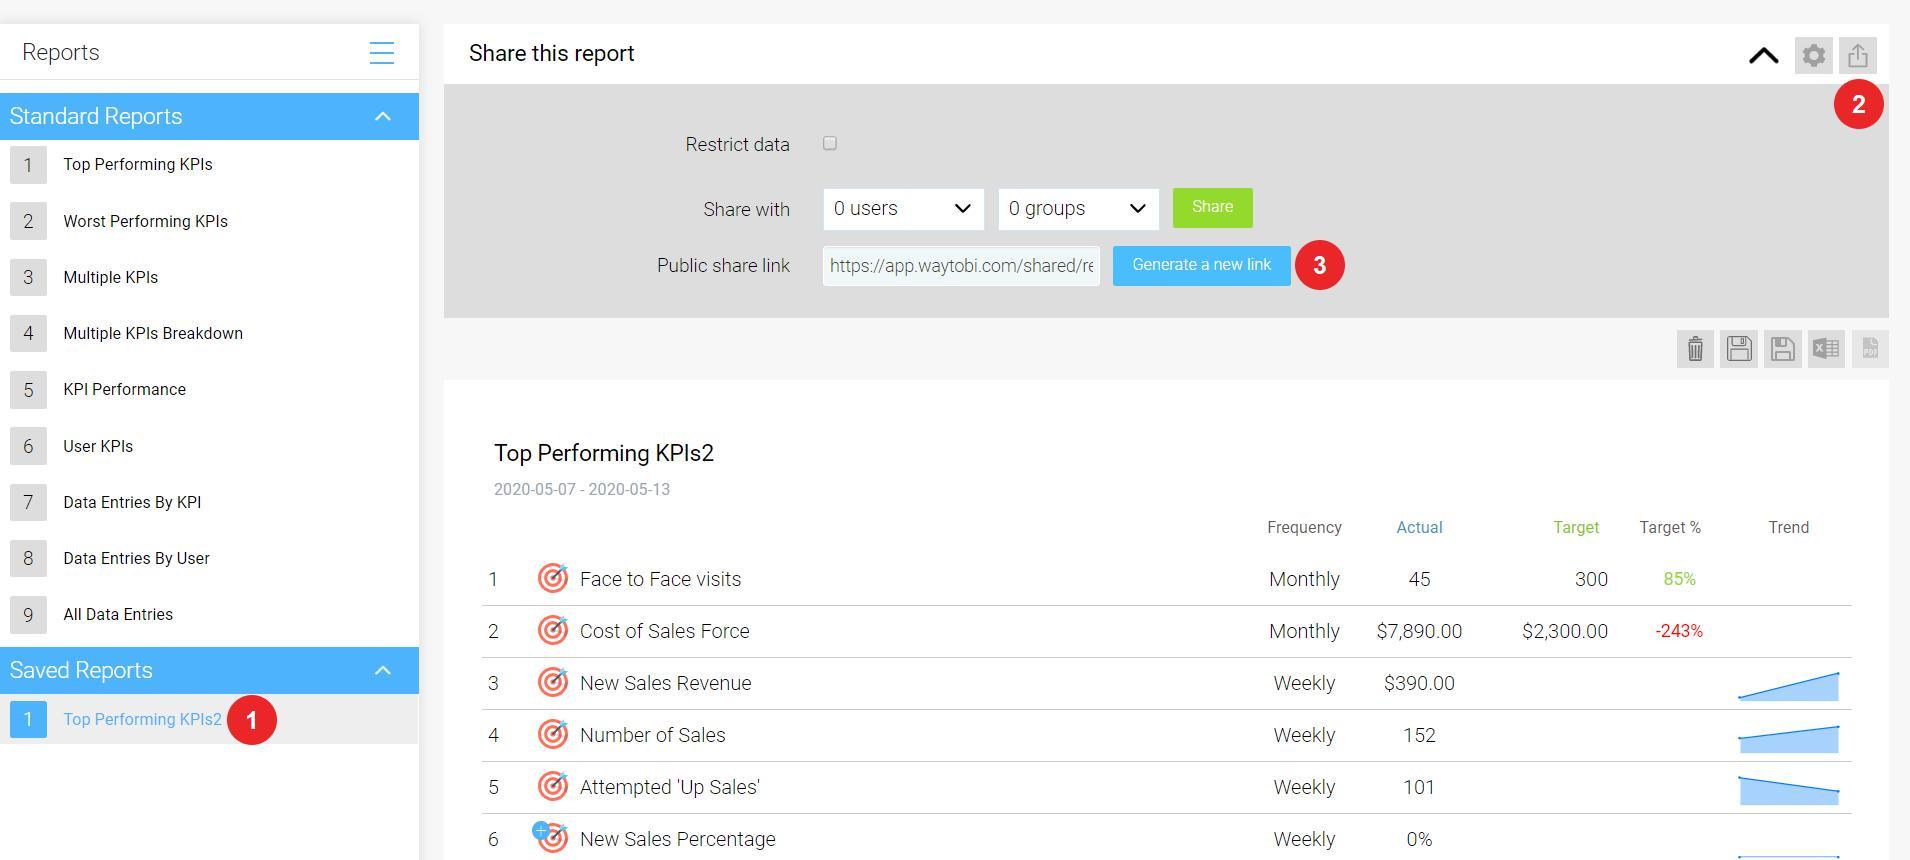
To share a report externally, please follow these steps:
Chose one of your saved reports you want to share with;
Click the Share icon;
Click Generate a new link.
Generated link could be copied to browser and used externally.
Note: You can share only custom (saved) reports, but not the preset ones.
Unable to find an answer?
Looking for anything specific article which resides in general queries? Just browse the various relevant folders and categories and then you will find the desired article.
Some of our site pages utilize cookies and other tracking technologies. A cookie is a small text file that may be used, for example, to collect information about site activity. Some cookies and other technologies may serve to recall personal information previously indicated by a site user. You may block cookies, or delete existing cookies, by adjusting the appropriate setting on your browser. Please consult the HELP menu of your browser to learn how to do this. If you block or delete cookies you may find the usefulness of our site to be impaired.
To know more about how our privacy policy works, please visit our website.