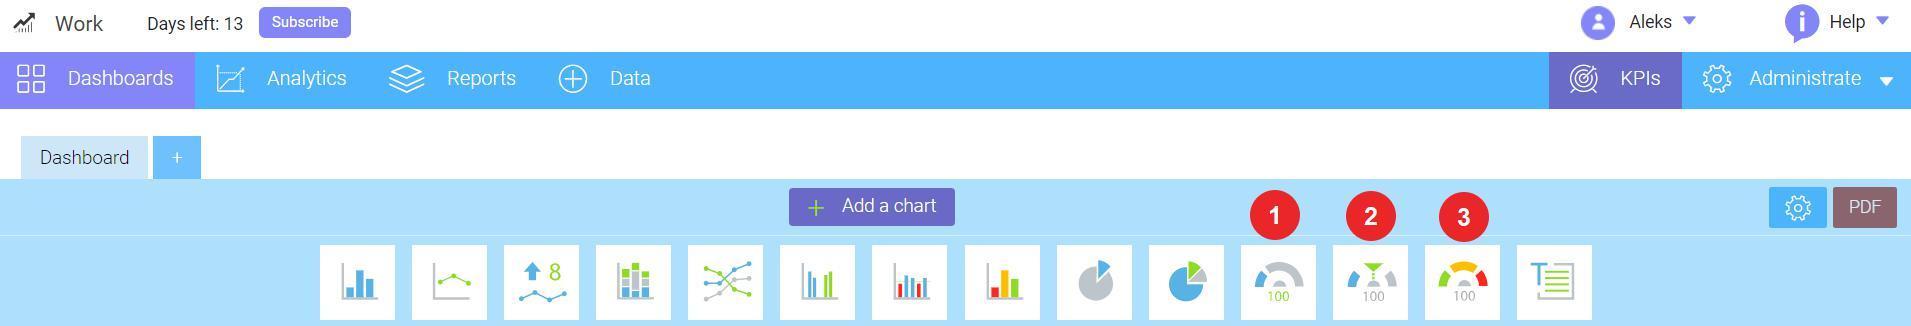
Waytobi offers three types of Gauges that can help you to visualize KPIs related to Target, Goals and Thresholds (RAG).
In this section we will discuss the following:
The target gauge is a simple gauge that shows an actual performance of a KPI. If KPI has target value, it will be also reflected on this gauge. To add a target gauge, follow these steps:
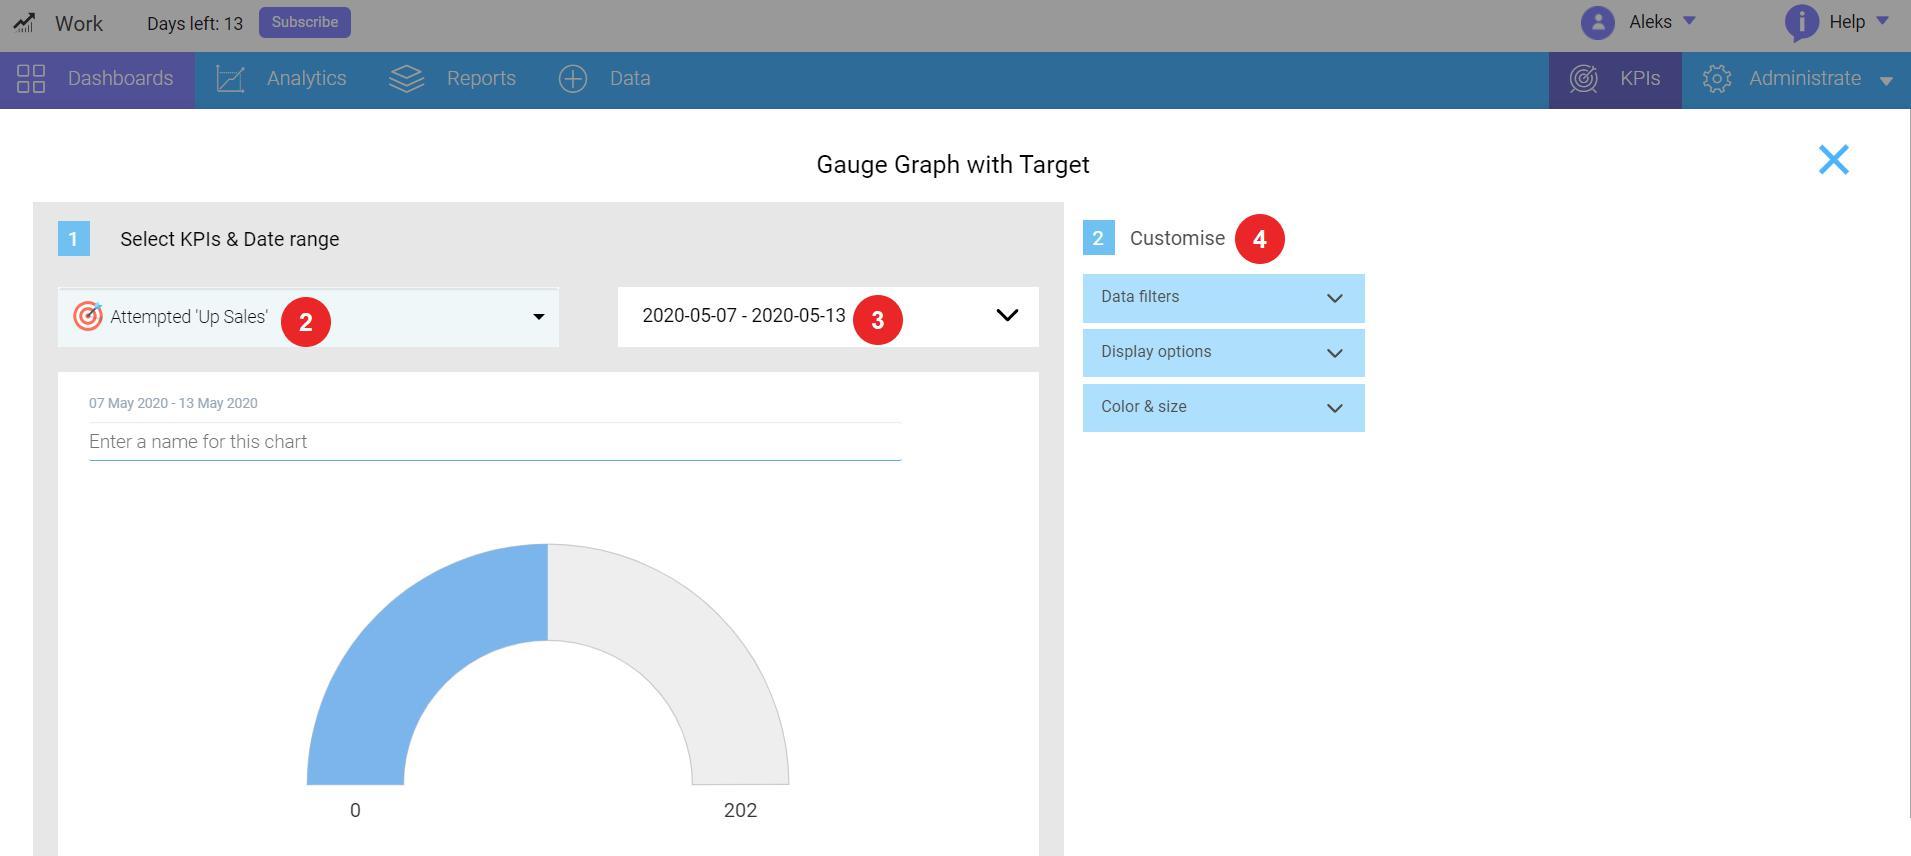
Note: You can customize the size, colors, filters and values of the gauge on the options panel.
The goal gauge displays the performance of a chosen KPI in relation to the established goal.
To add a goal gauge, please follow these steps:
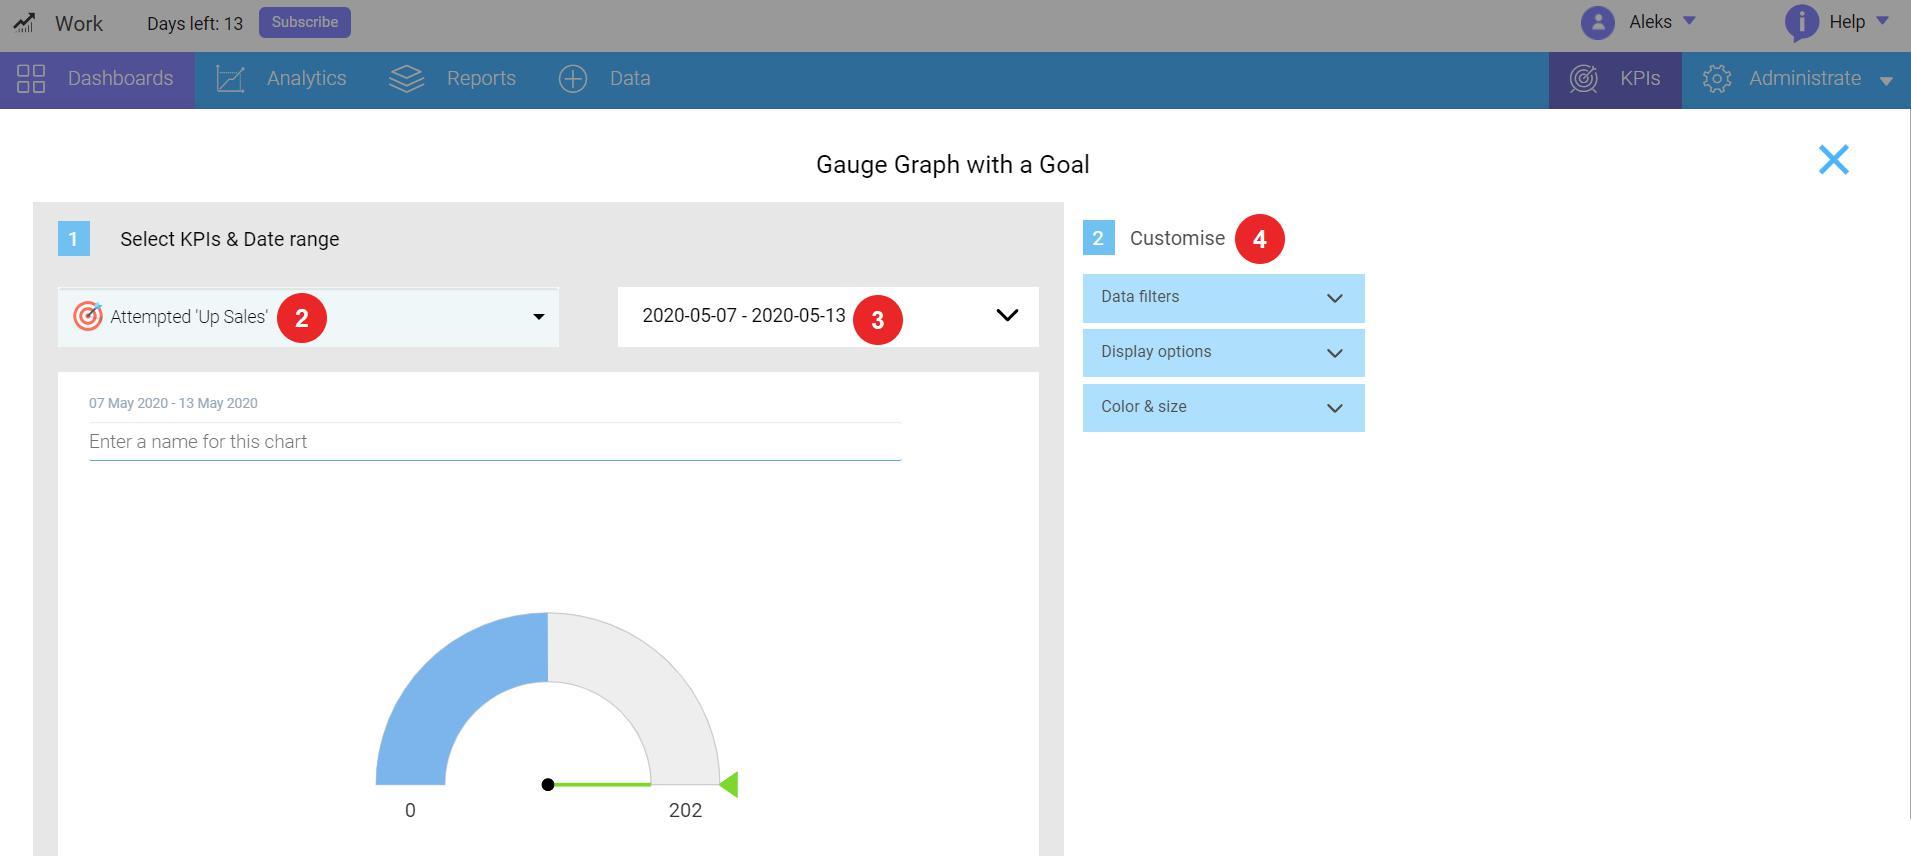
The goal gauge displays the information relevant to your goal:
The RAG Gauge is a useful tool to visualize your KPI performance with a threshold already set. It provides a clear information of your KPI value and depicts its color in relation to the thresholds set.
Note: You can add RAG thresholds when setting up a KPI in the options panel.
To add a RAG Gauge, follow these steps:
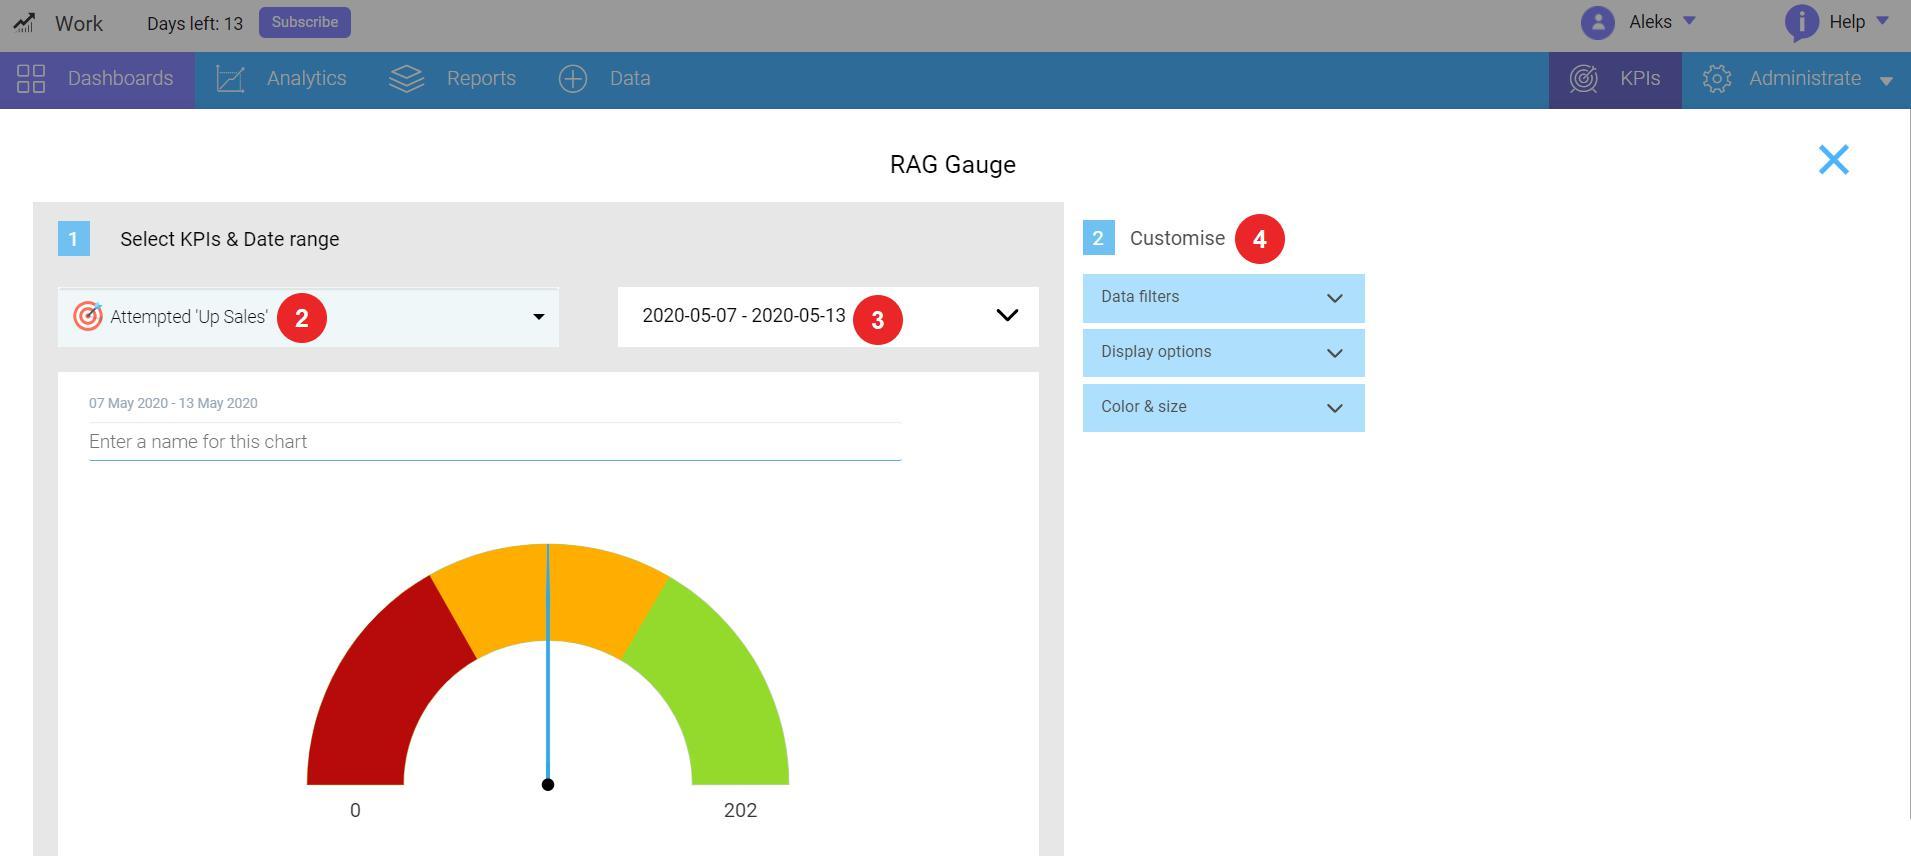
Note: The values of the KPI in a selected time period will be multiplied along with RAG thresholds. You can change this setting in KPI Advanced setting (KPI Tab) and set up and average value to be used instead.
Looking for anything specific article which resides in general queries? Just browse the various relevant folders and categories and then you will find the desired article.
Contact Us