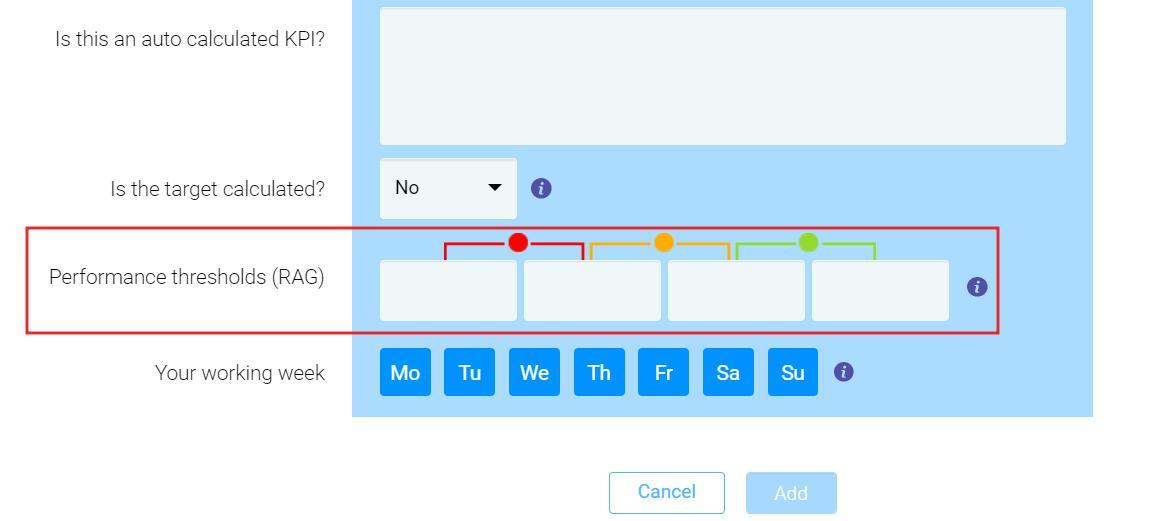
You can upgrade the KPI monitoring with defined thresholds and RAG indicators. Each threshold corresponds to one of the three colors — Red, Amber and Green. The lights refer to as the traffic light colors so user can analyze KPI performance fast.
In this section we will discuss the following:
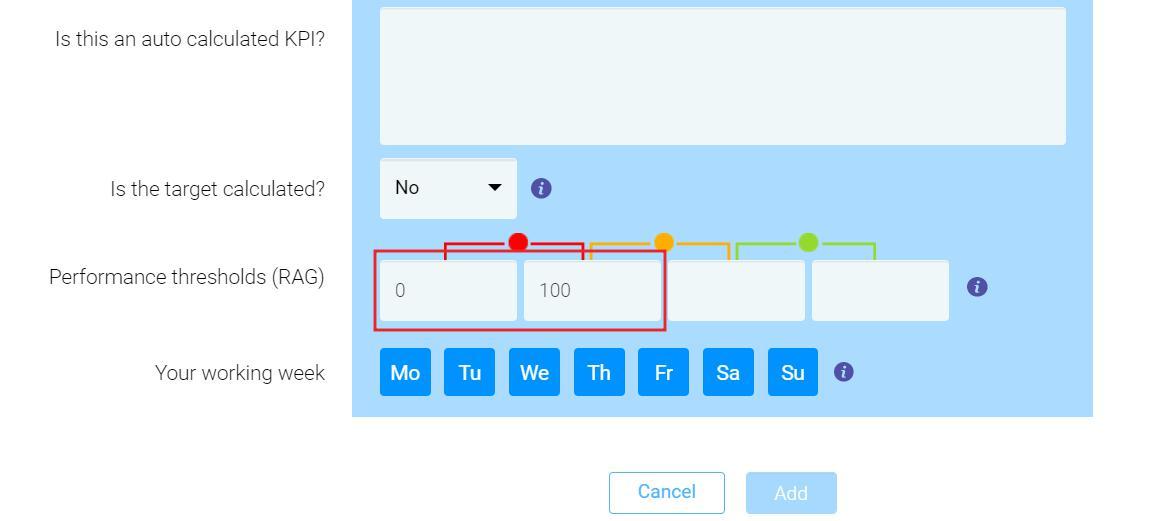
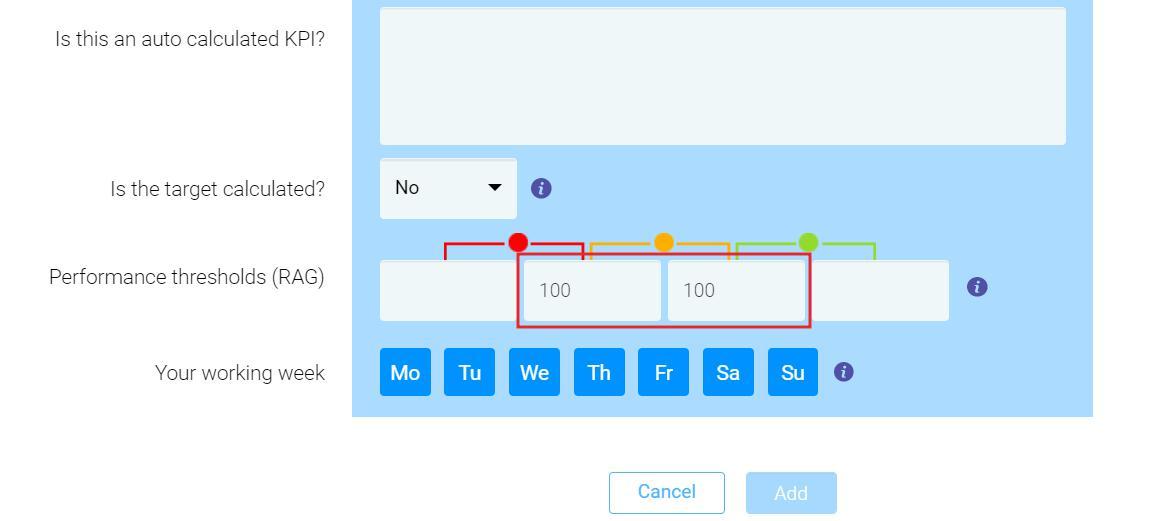
To set the full range of indicators you need to follow these steps:
If you don't need the full range, you can use single range to know if the KPI value reaches a required threshold. This case, you can set thresholds for one color zone of indicators.
To set up a single range, just repeat the steps on the previous section but set up the threshold values (Start and End) for only one color zone of indicators (Red, Amber or Green).
Open-ended range, means that all data below and above settled value, appear in Red or Green. For example, all sales under 100 will be indicated as Red, and above 100 — Green. You can set only one open-ended range threshold at a time.
To set up an open-ended range you need to do following:
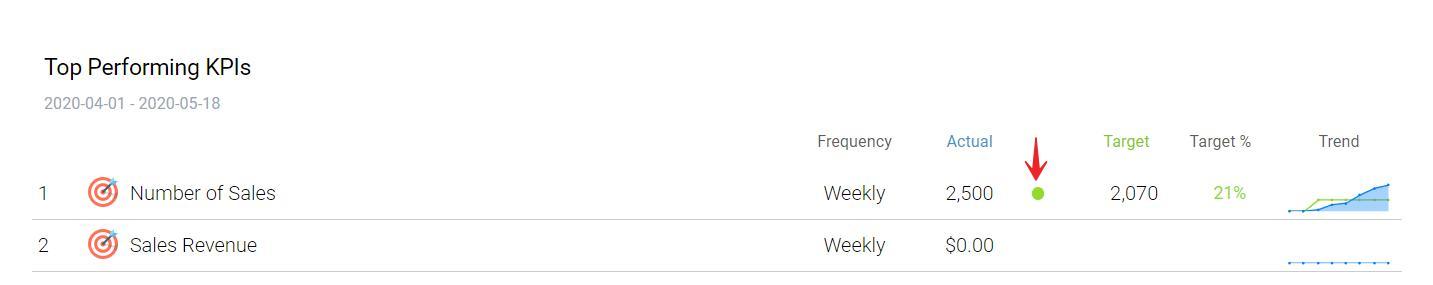
KPIs with thresholds and RAG indicators will automatically appear on dashboards and reports.
You can find the RAG indicators displayed as small Red, Amber or Green circles next to your KPI values.
Looking for anything specific article which resides in general queries? Just browse the various relevant folders and categories and then you will find the desired article.
Contact Us