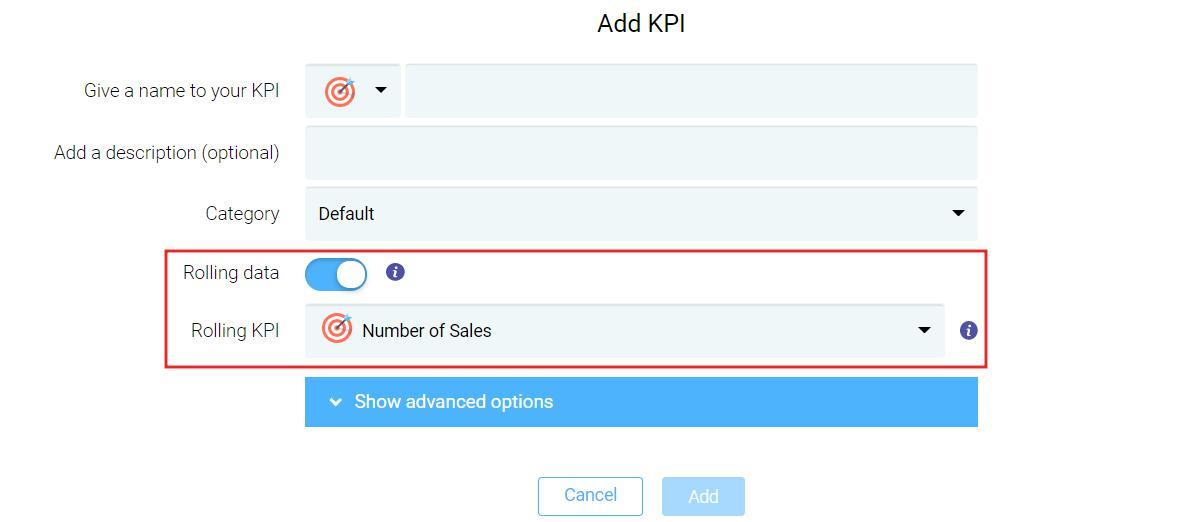
Rolling KPI or KPI with rolling data is KPI that is automatically calculated as the sum or average value of a predefined number of time intervals. The number of intervals can be changed in the KPI settings when creating or editing it.
Rolling KPI is convenient to use for both, visualization of the general KPI trend and inside the calculated KPIs.
Using a report based on rolling KPI is a useful tool for any organization to use in tracking of progress and displaying trends. As an example, if your KPI is 12 months rolling, it means that the results would look like sum / average of data for the past 12 months. Every next month, the value is updating by adding new month data and deleting data from the starting month so it would look 12 months are rolling forward through the calendar.
Note: Rolling KPIs appear on the data entry sheet with data placed (result of calculations). You cannot change it or fill your custom data to this type of KPIs.
Looking for anything specific article which resides in general queries? Just browse the various relevant folders and categories and then you will find the desired article.
Contact Us