Welcome to Waytobi! Let's walk you through the steps of setting up your account so you can get to work fast.
If you are new to Waytobi, the first order of business should be creating an account. You can click here for that.
Now, let's watch this video to help you get started. You can find more videos on the topic here.
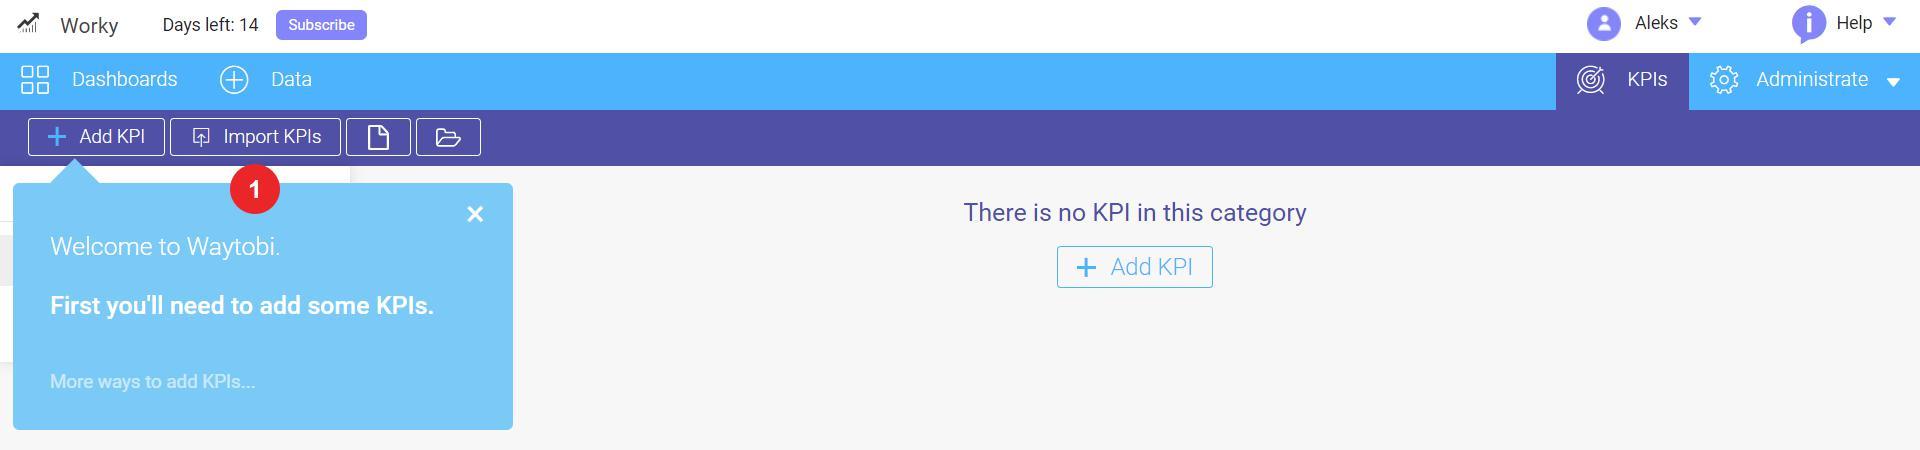
After creating the account and first login you will see Getting started view to help you set-up your account.
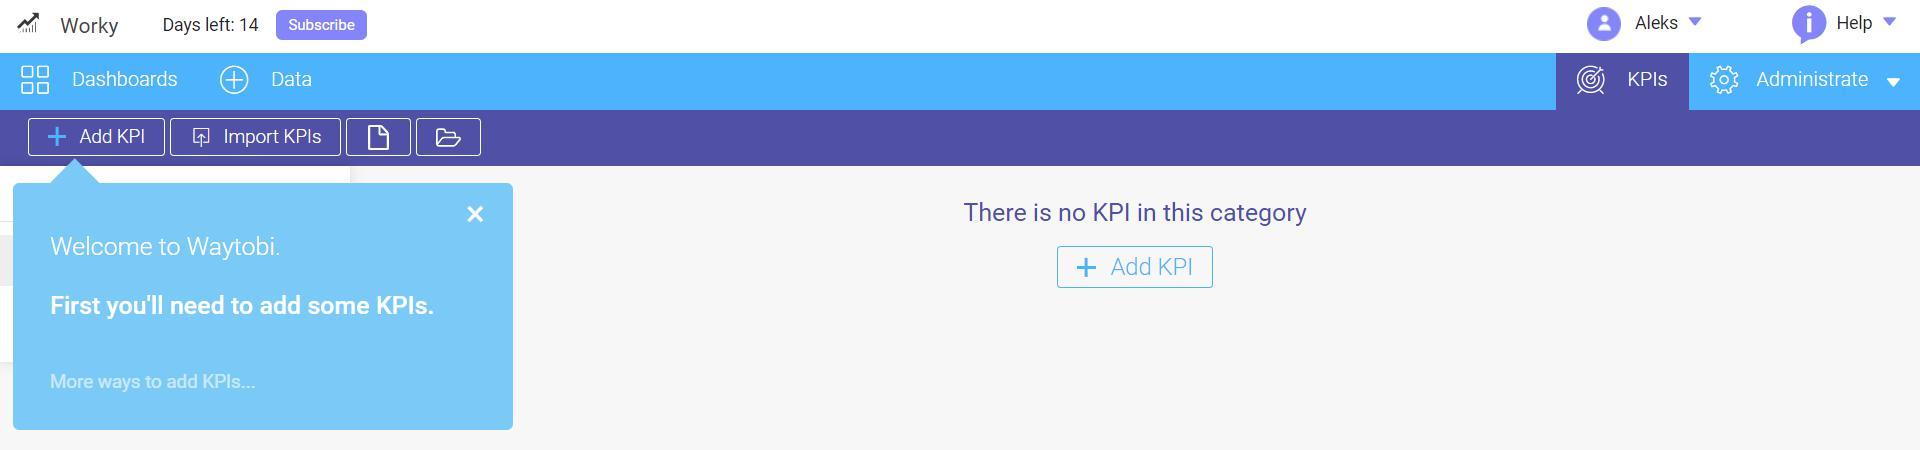
If you will need to contact support, learn more about KPI tracking and Waytobi in general, you can do all that from this
screen either.
These are the steps we will go through in order to create your account:
Begin with using the KPIs tab on the right side of the menu to:
1.1 Add a new KPI manually
1.2 Import your KPIs, if you already have them
If you are hesitant about which are the best KPIs you can choose for your business you can go through our KPI Store to
choose those relevant for you.
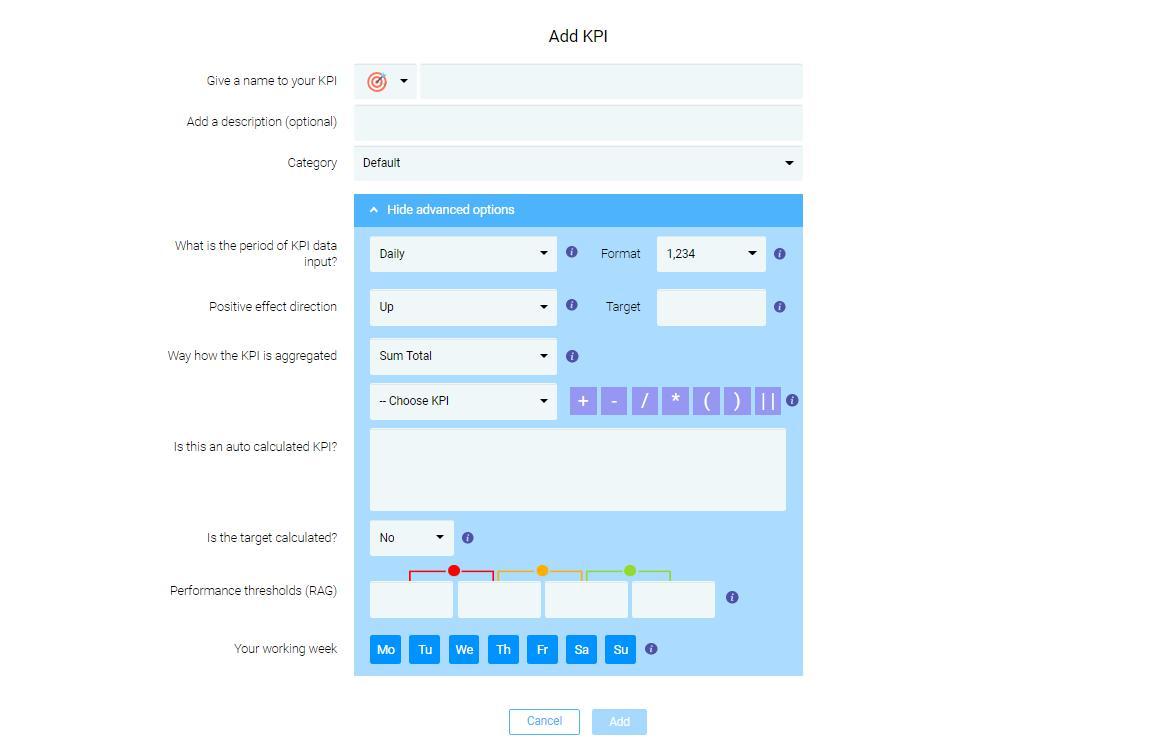
1.1 Add a new KPI manually
Now let's go through the steps you'll need to take to add a KPI manually: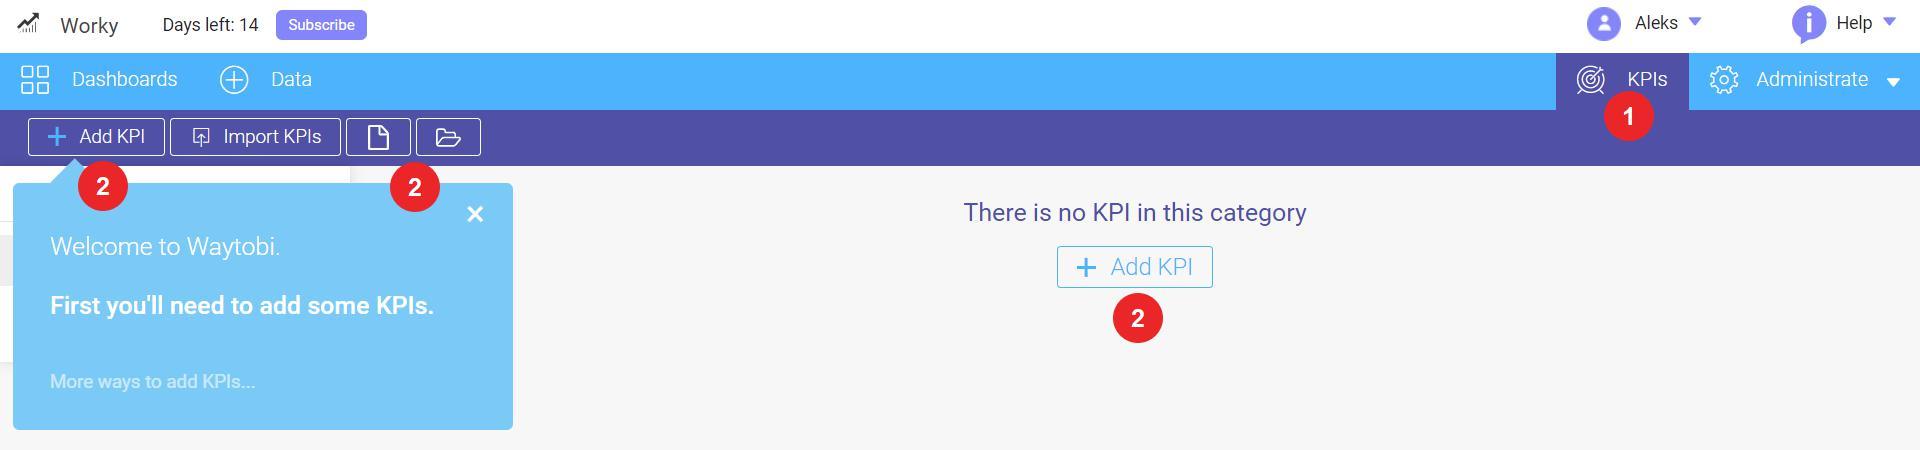
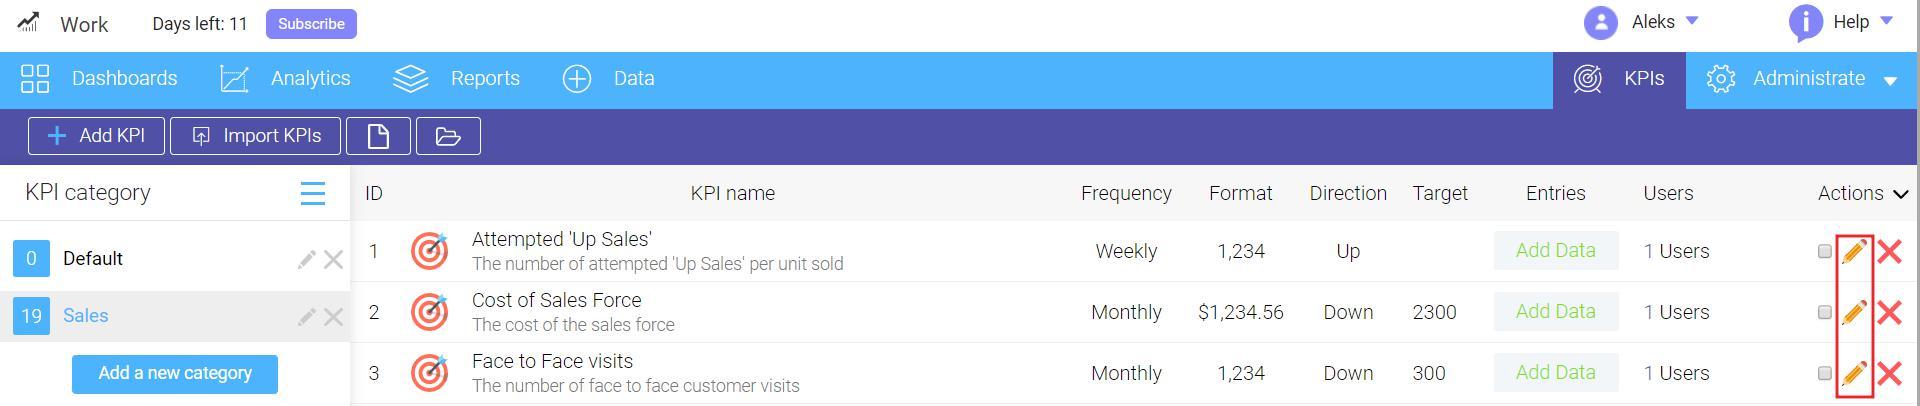
You've just created a KPI which is automatically added to your KPI list. If you wish to create a new one please click the Add KPI button and repeat the process.
If you want to create a Calculated KPI you should click the Show advanced options button to access it, as well as many other options. You can learn more about calculated KPIs here.
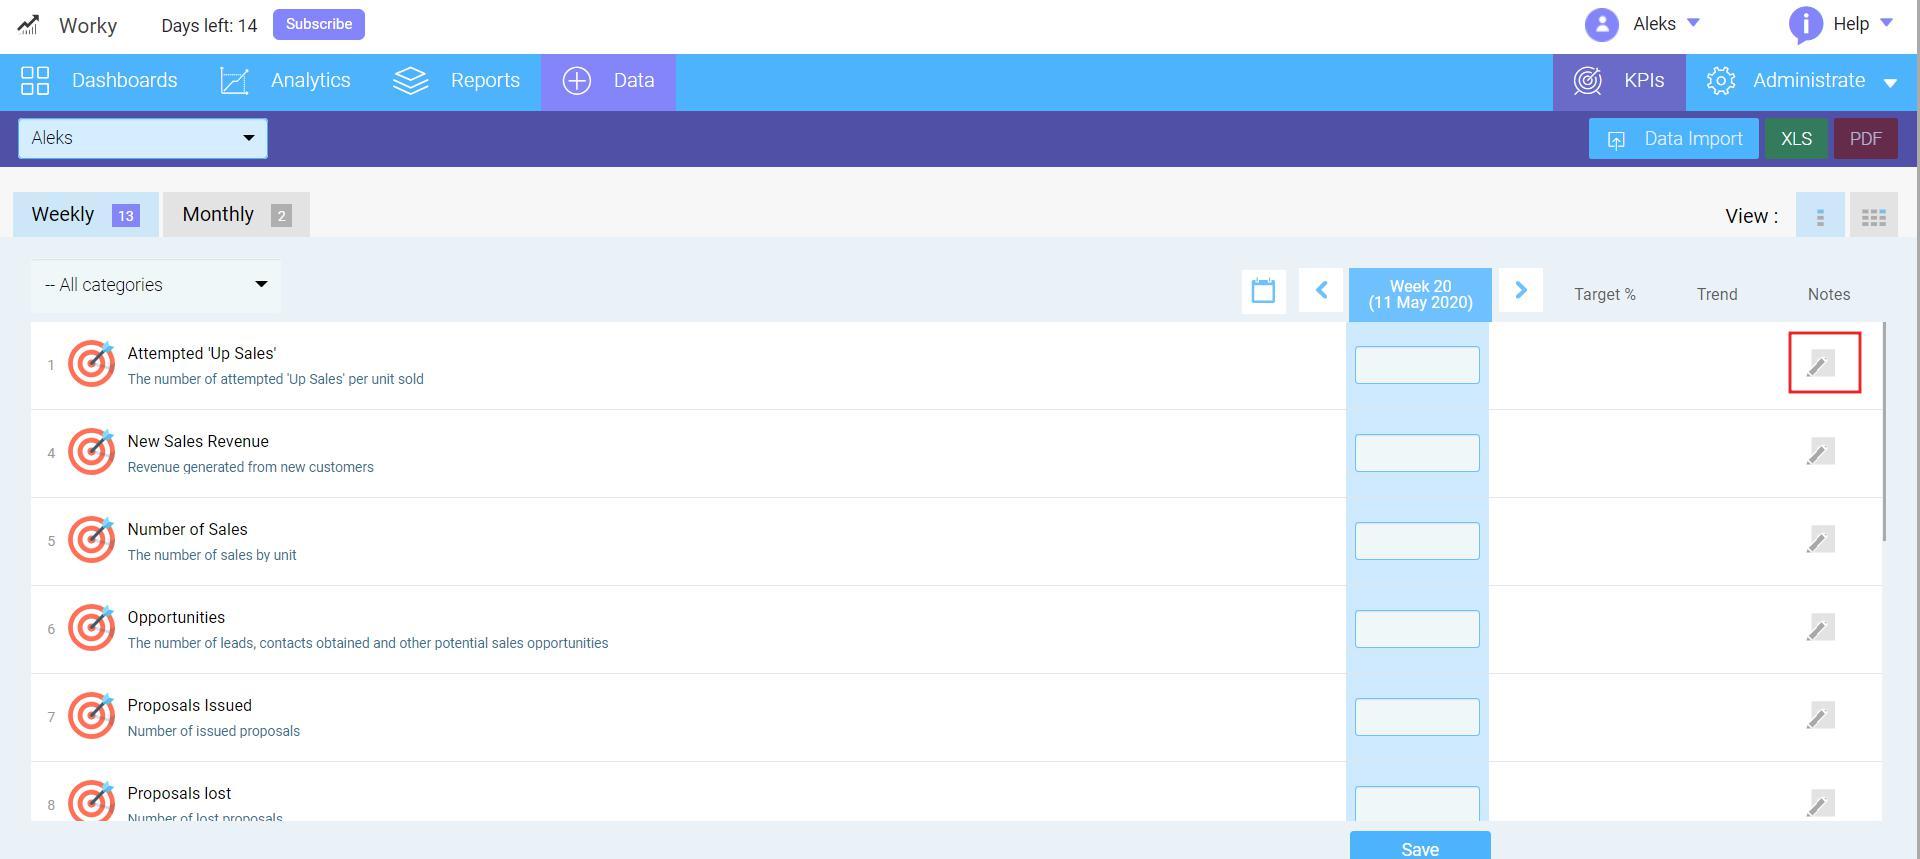
After the KPIs are created you can click the Edit (Pencil icon) button on the right side of the KPI line to make adjustments to it.
1.2 Import your KPIs, if you already have them
If you already have your KPIs on an Excel spreadsheet and you want to import those to the platform, you will have to bring your data into the Waytobi standard. You can click here to learn more about spreadsheet imports or you can follow these steps to get it done:

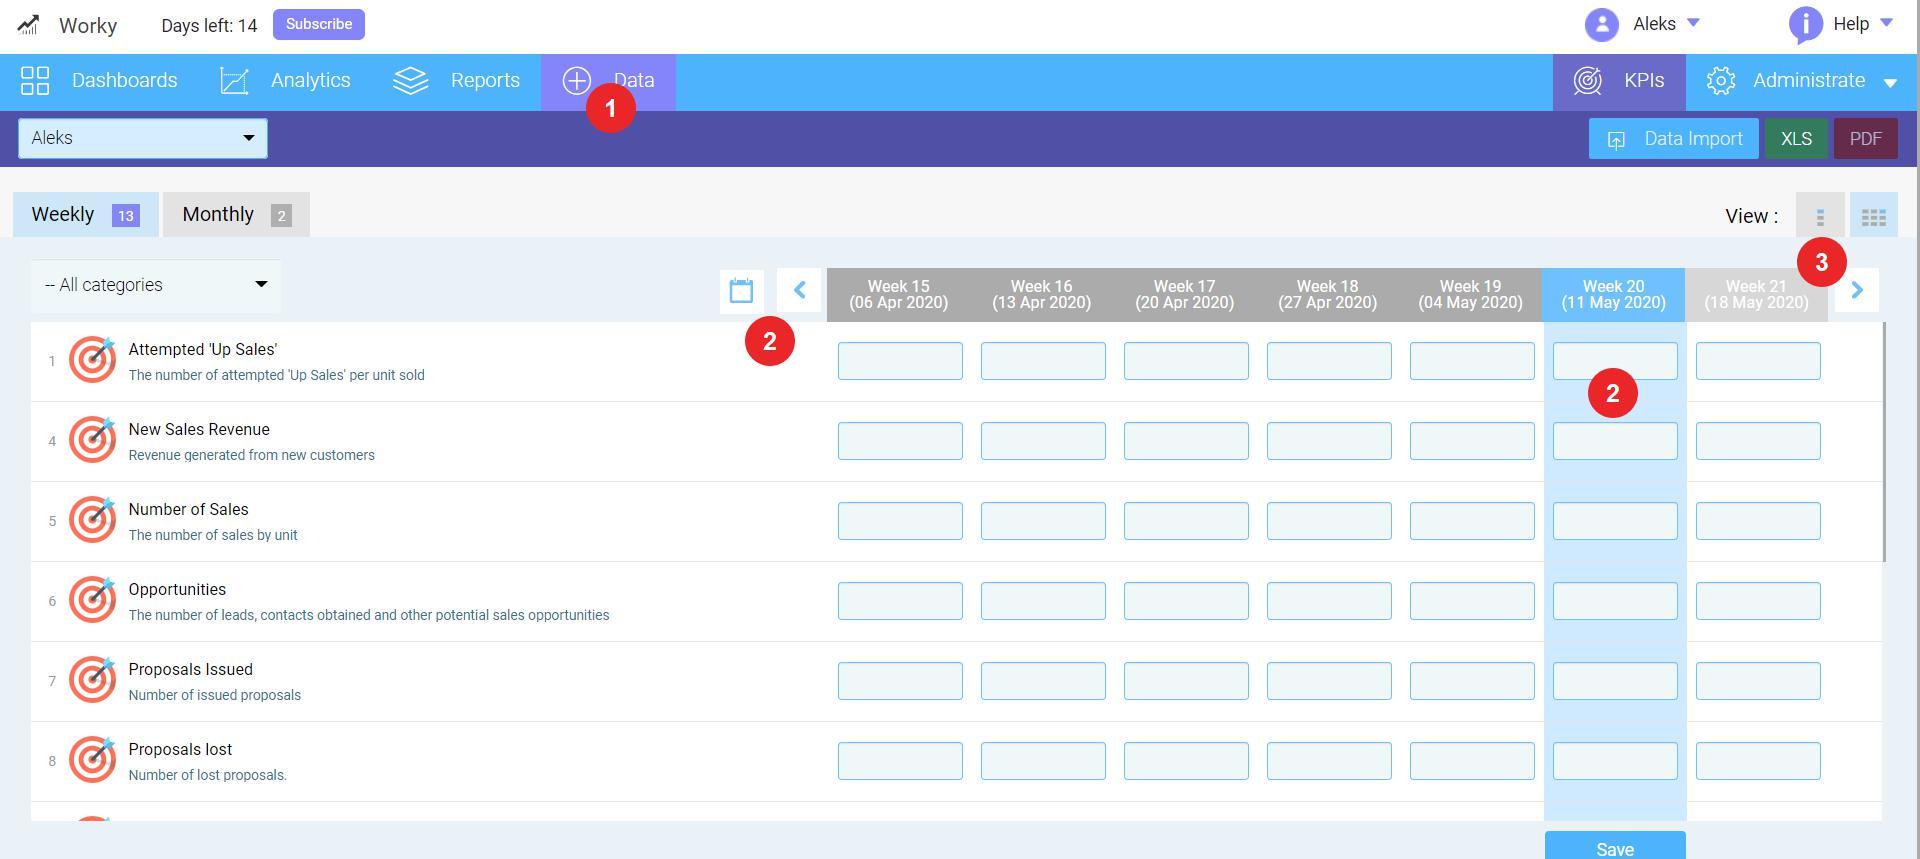
Below are two common ways to add data to your account:
The steps are to follow for filling data manually:
When you finish adding data to your account you can start creating dashboards, reports, and analytics views. These will help you visualize your data and understand it better.
To create a dashboard, you will first need to open the Dashboards tab. If you don't have a dashboard yet, the Add a Dashboard panel will appear after pressing «+», so you can create your first dashboard. To do that you'll need to go through the following steps:
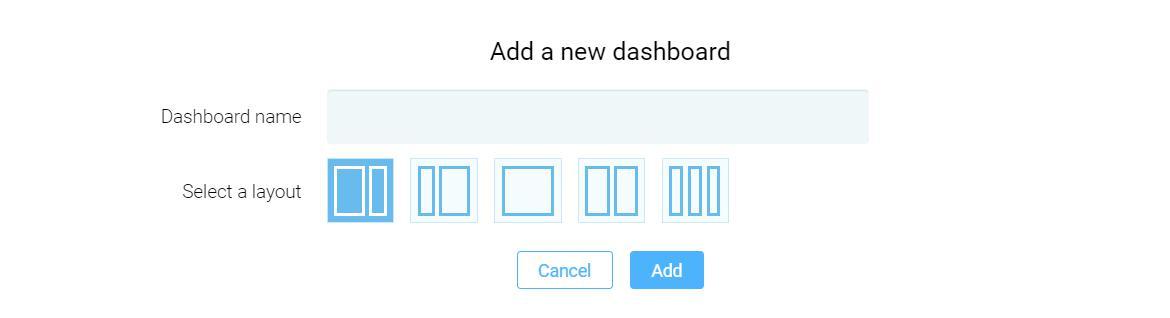
Now you have your first dashboard and you can start adding graphs, charts, and views.
To add a new view to your dashboard please click the Add a сhart button to see all the types of graphs and charts you can choose from.
Once you select the chart type a pop-up on your screen will appear to let you choose the KPI and the dates to build the chart. Here you will have to:
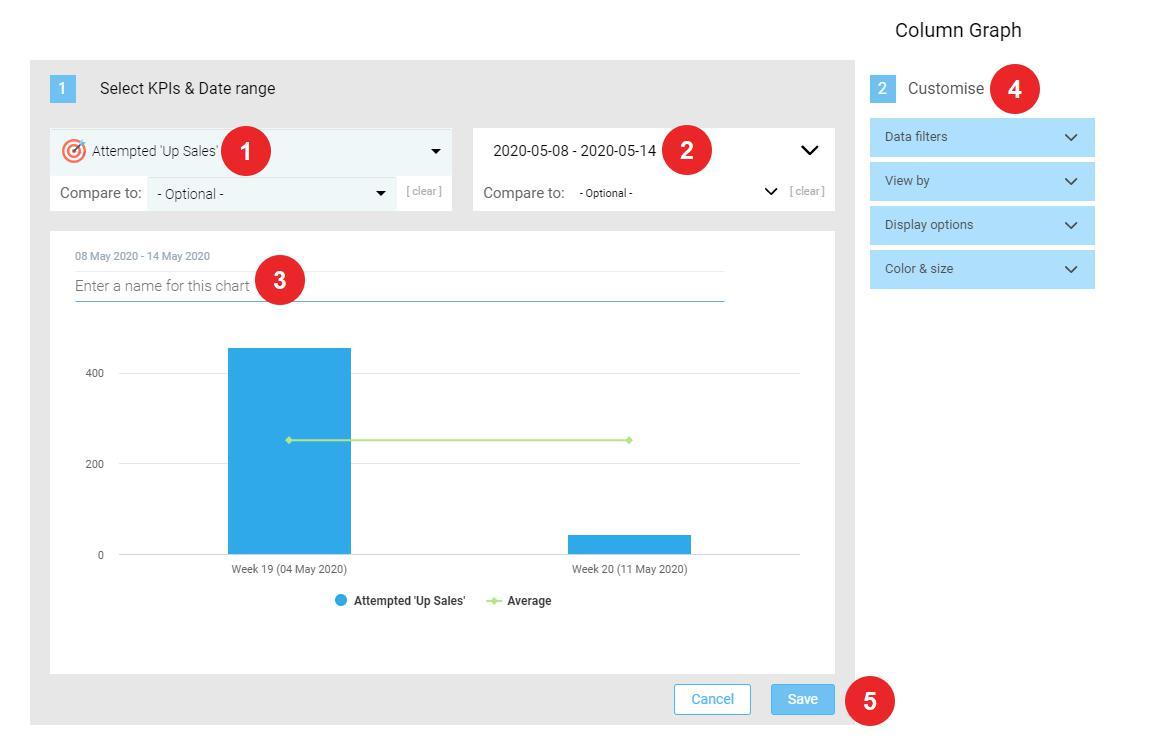
Select the KPIs you want to have in the chart;
Select the date range;
Customize the name of the view from right above the chart;
Choose from the data filters and display options to customize your chart;
If you think it all looks good, click the Save button to add it to your dashboard.
The more charts you create the better your dashboards will look and the easier it will get to access your data.
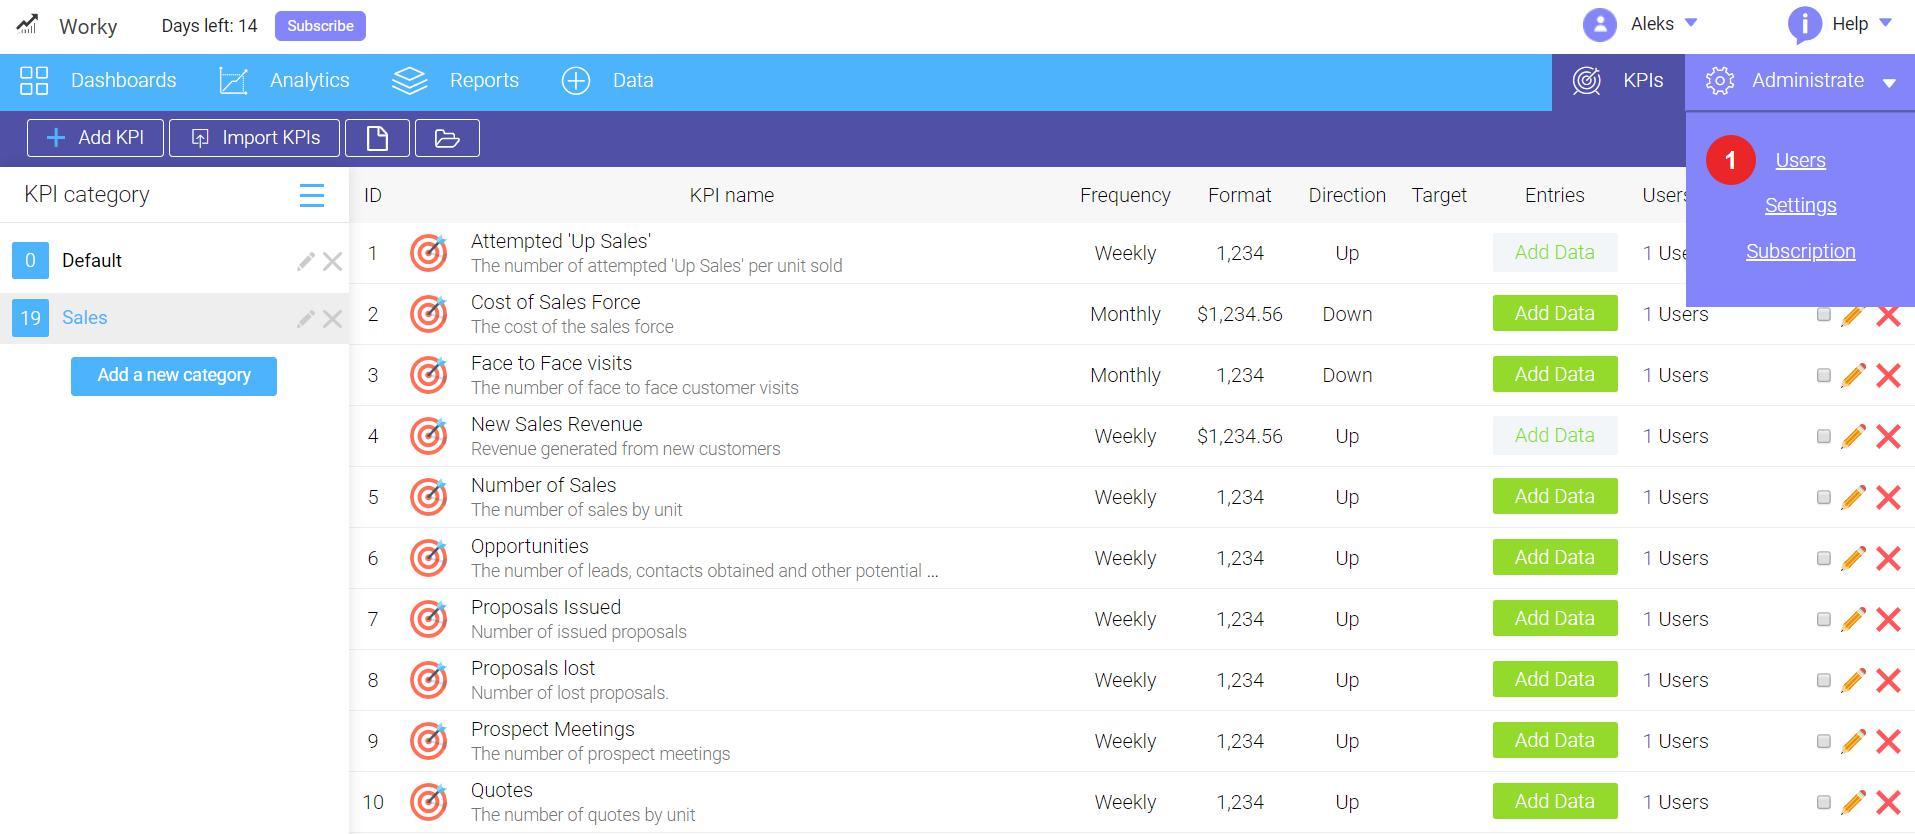
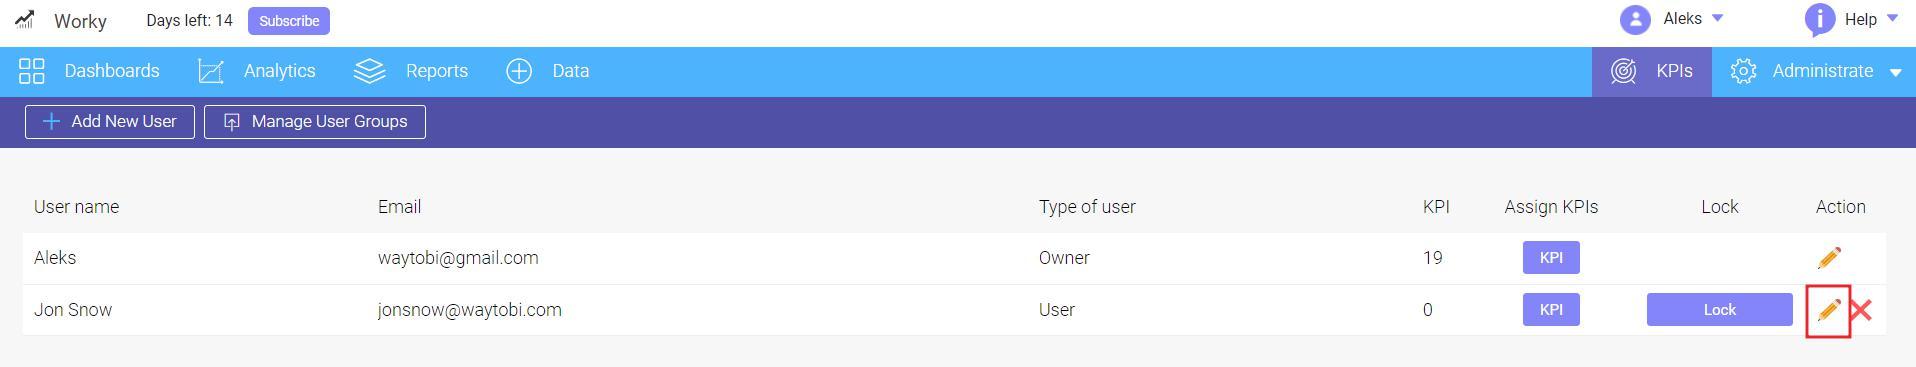
You can add new users to your account by clicking the Users from the Administrate drop-down on the right side of the navigation bar.
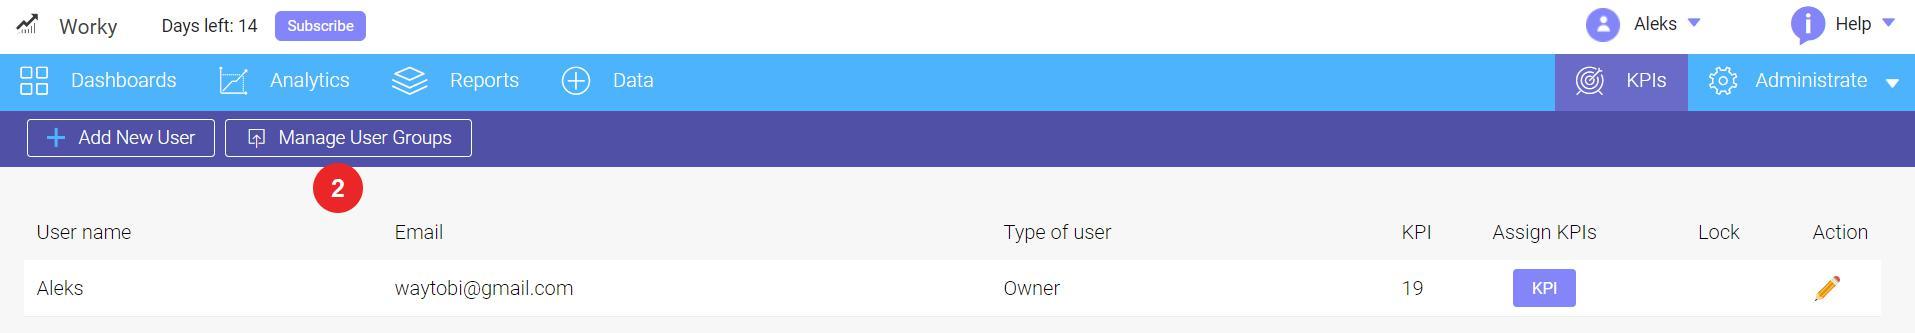
There are 2 different ways to add a user to your account. You can either add them manually or send an invitation to register in the system. You can put the users into different groups such as teams, offices or locations. The system can provide you with reports and analysis for each user as well as each group. To create a user group you should:
More about creating groups you will find here.
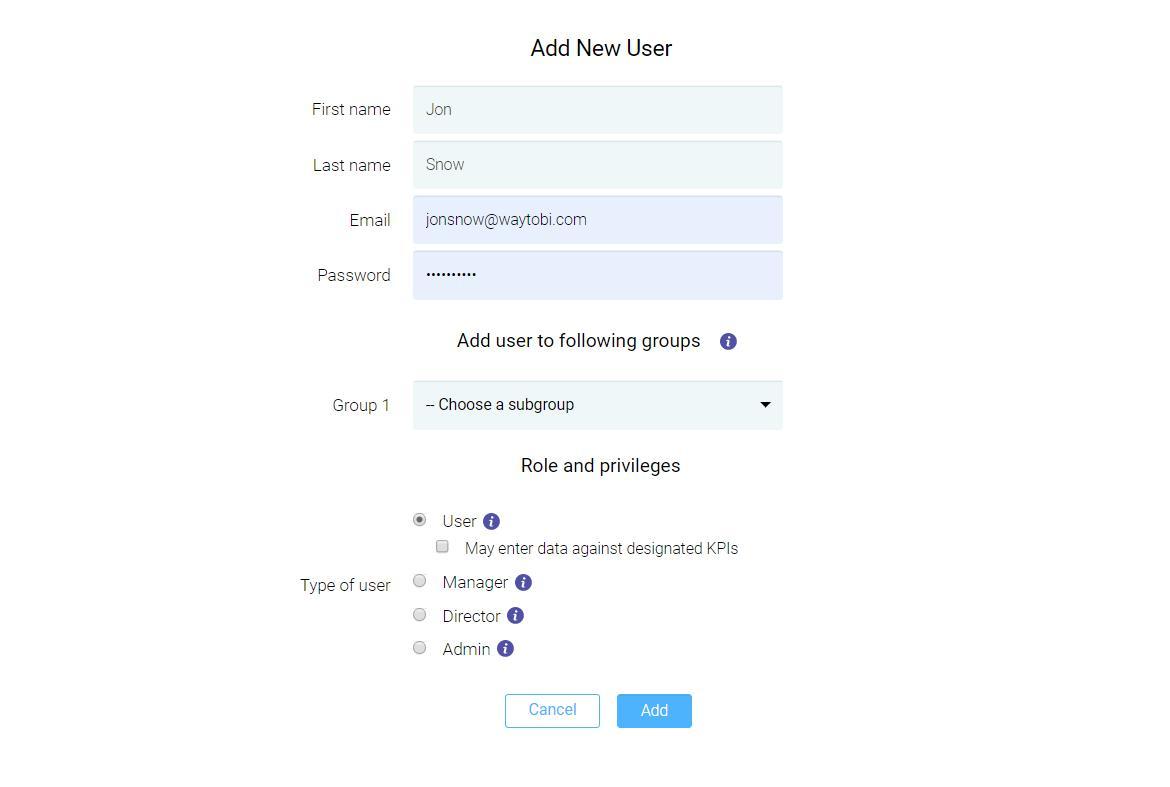
As soon as you have your groups ready you can add new users to those groups. Here is how:
Looking for anything specific article which resides in general queries? Just browse the various relevant folders and categories and then you will find the desired article.
Contact Us